. 2021 Nov;17(11):3833-3847.
doi: 10.1080/15548627.2021.1886720. Epub 2021 Feb 23.

Electroacupuncture ameliorates beta-amyloid pathology and cognitive impairment in Alzheimer disease via a novel mechanism involving activation of TFEB (transcription factor EB)

Affiliations

Electroacupuncture ameliorates beta-amyloid pathology and cognitive impairment in Alzheimer disease via a novel mechanism involving activation of TFEB (transcription factor EB)

Xiaoyan Zheng et al. Autophagy. 2021 Nov.

Abstract

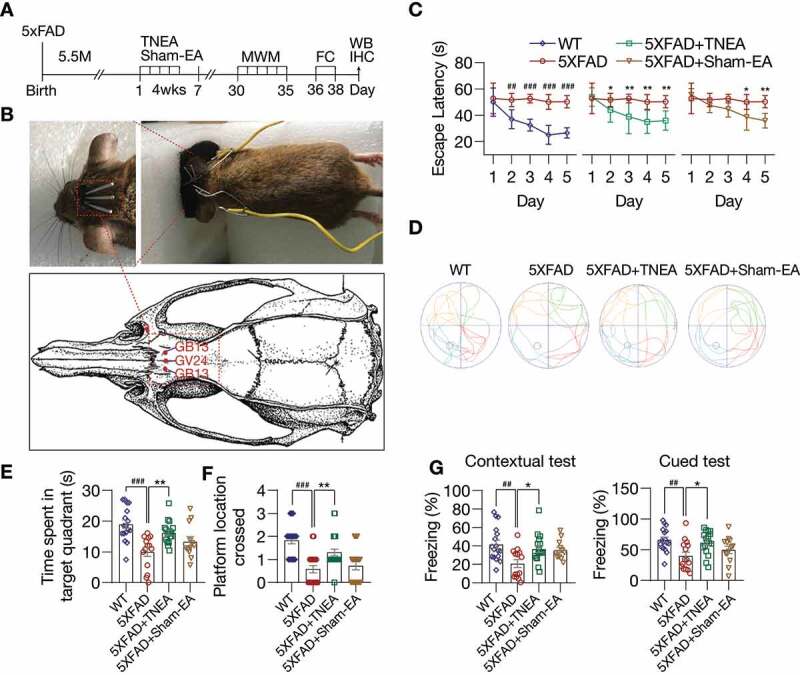
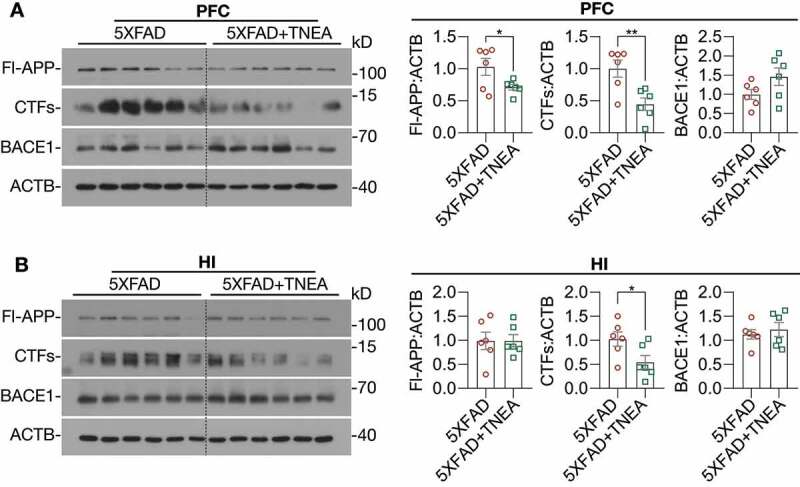
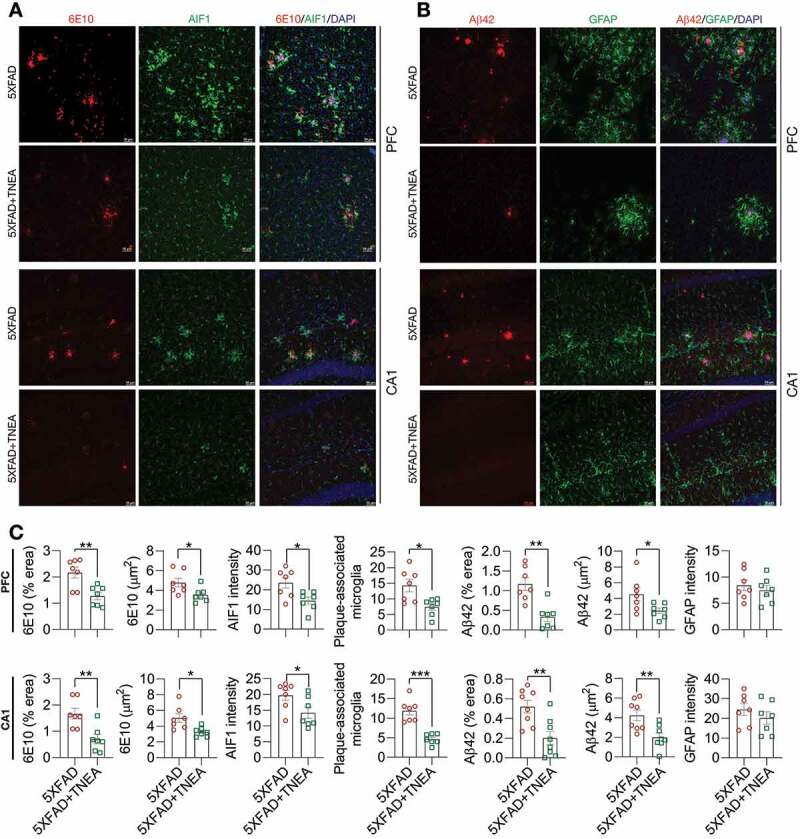
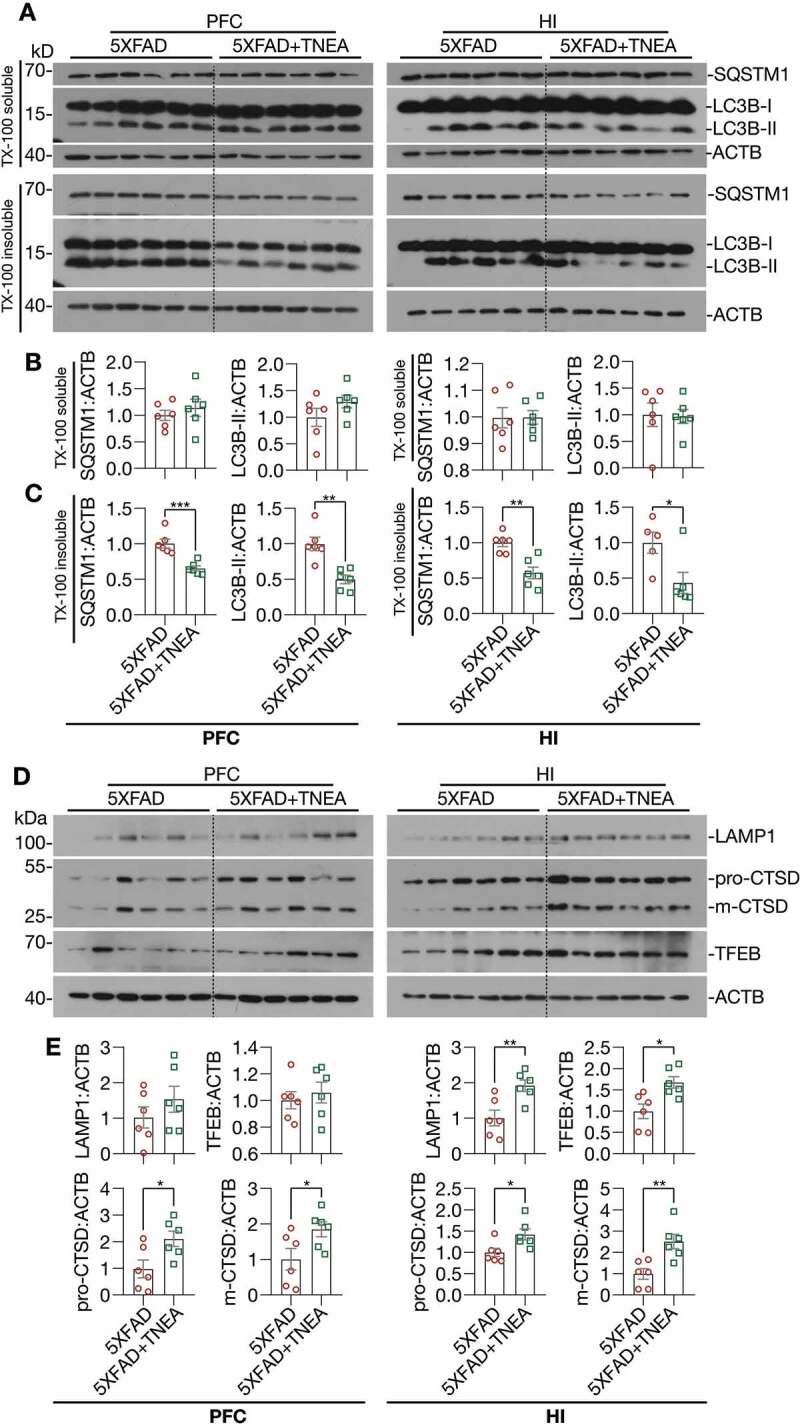
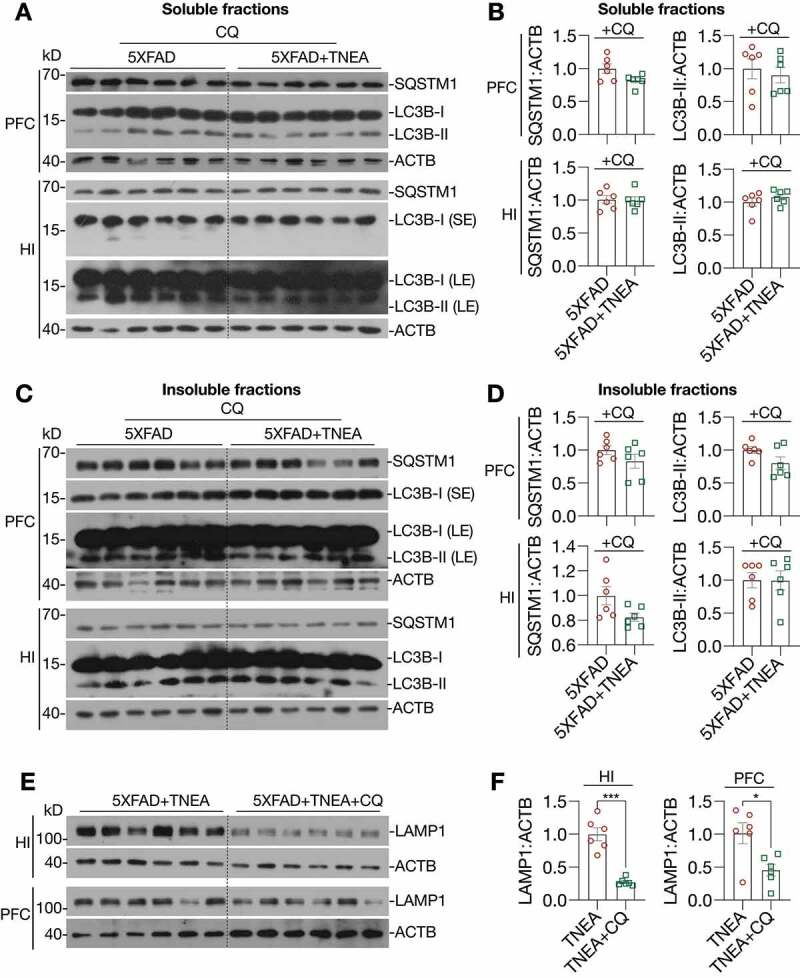
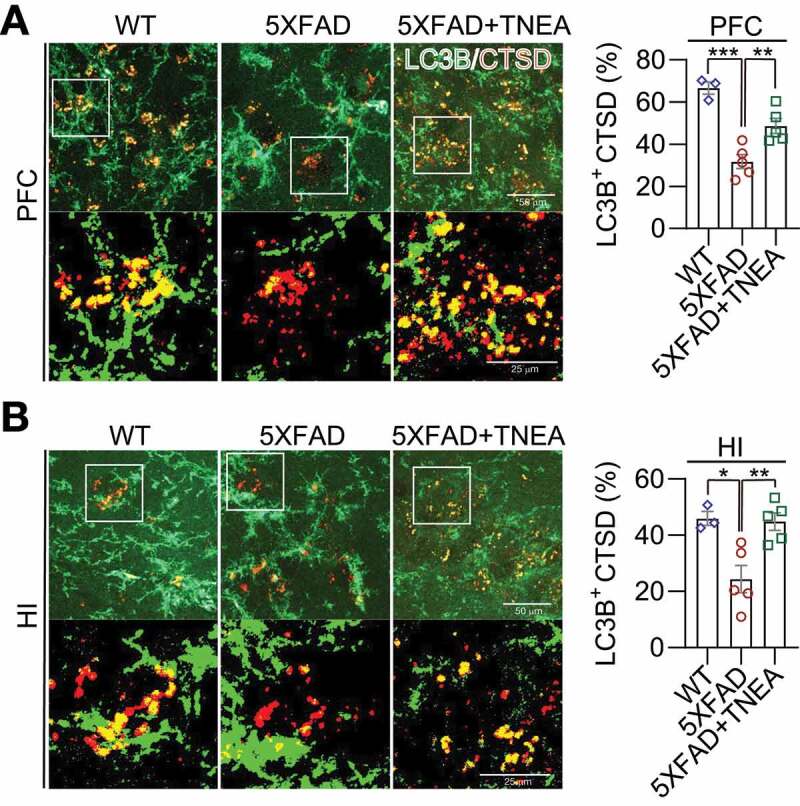
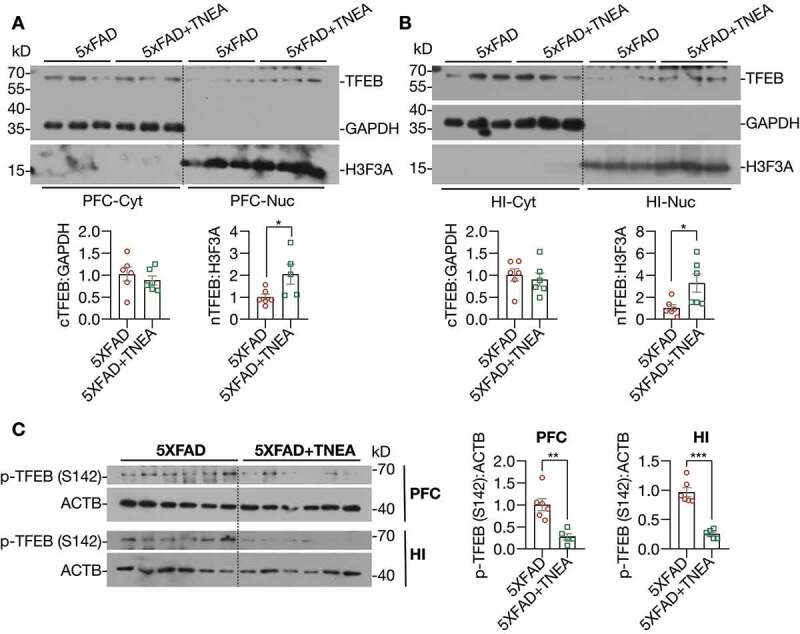
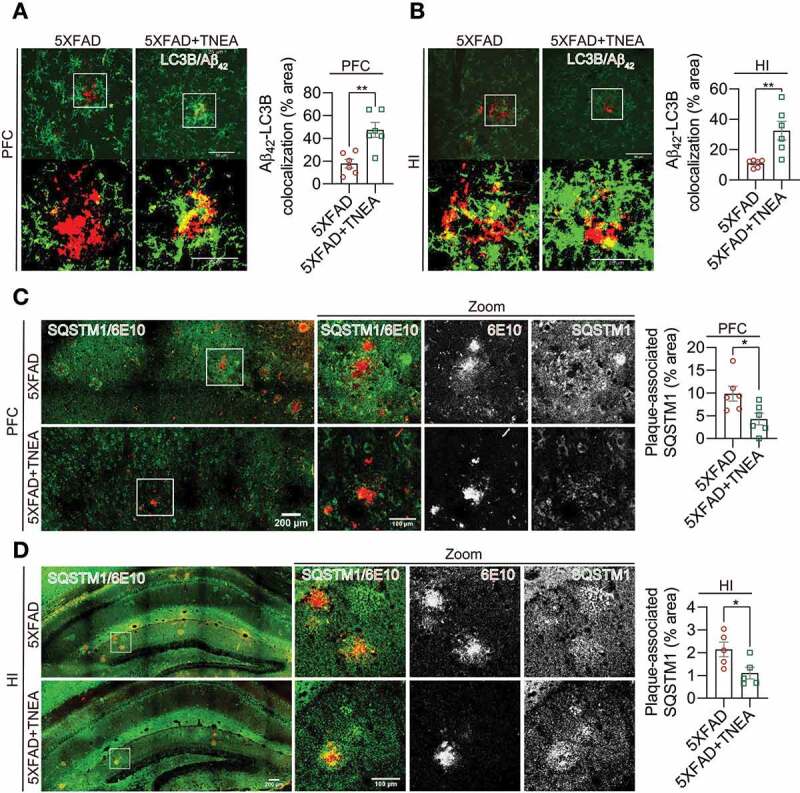
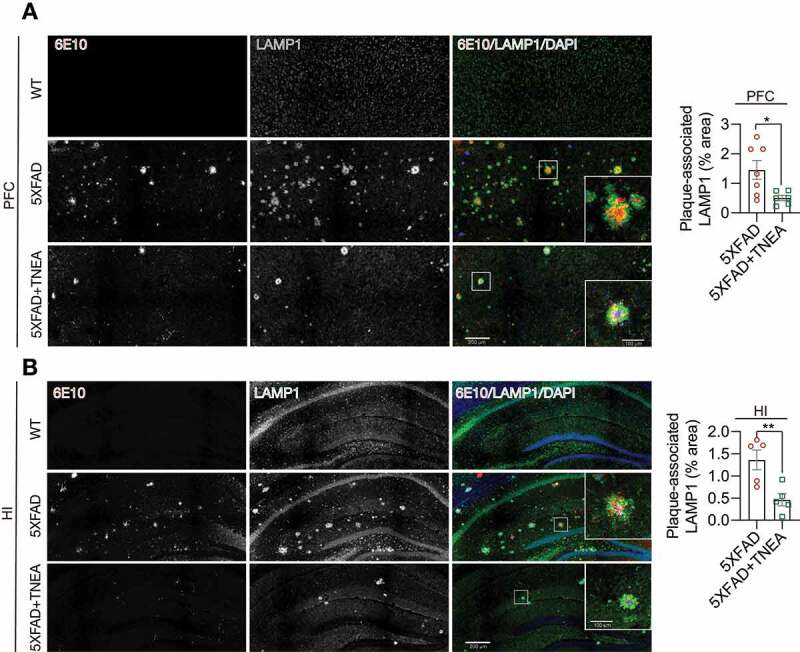
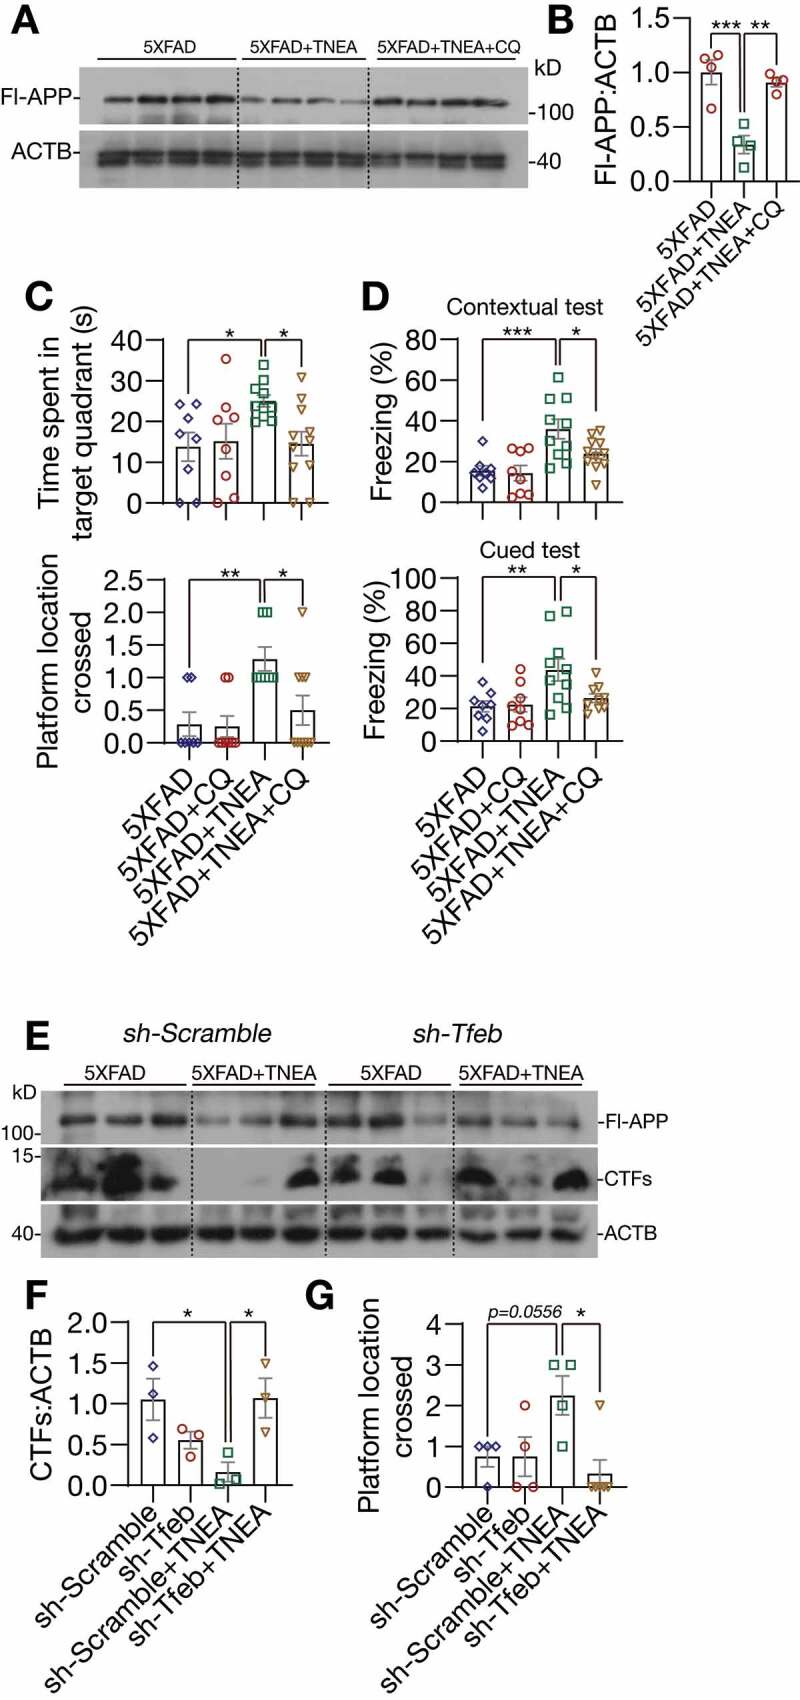
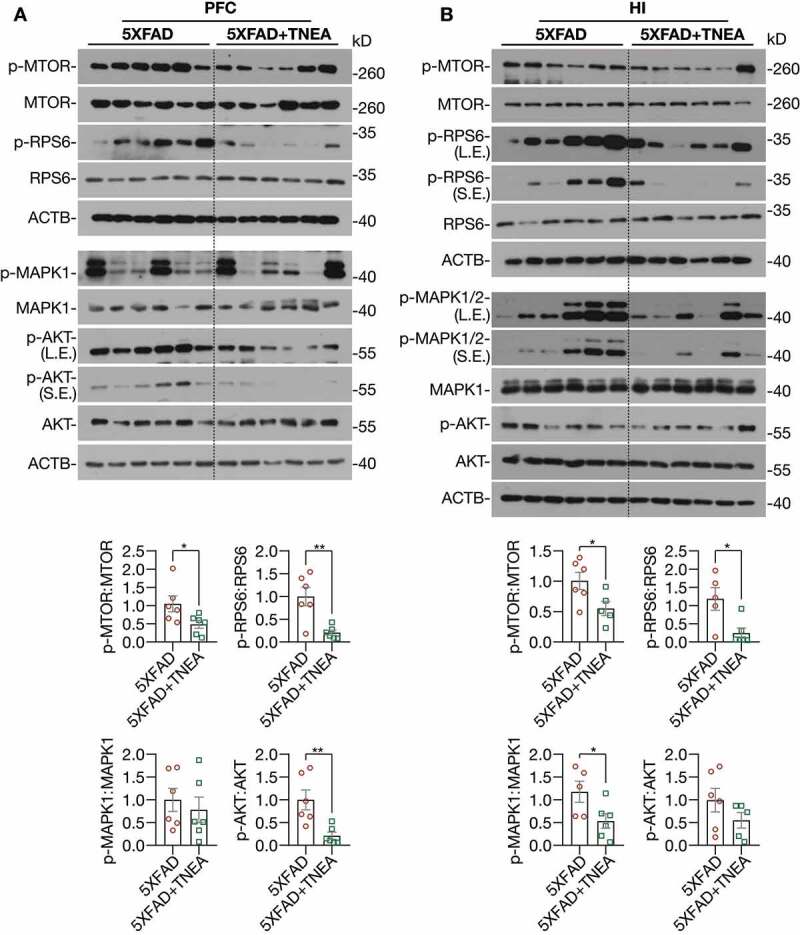
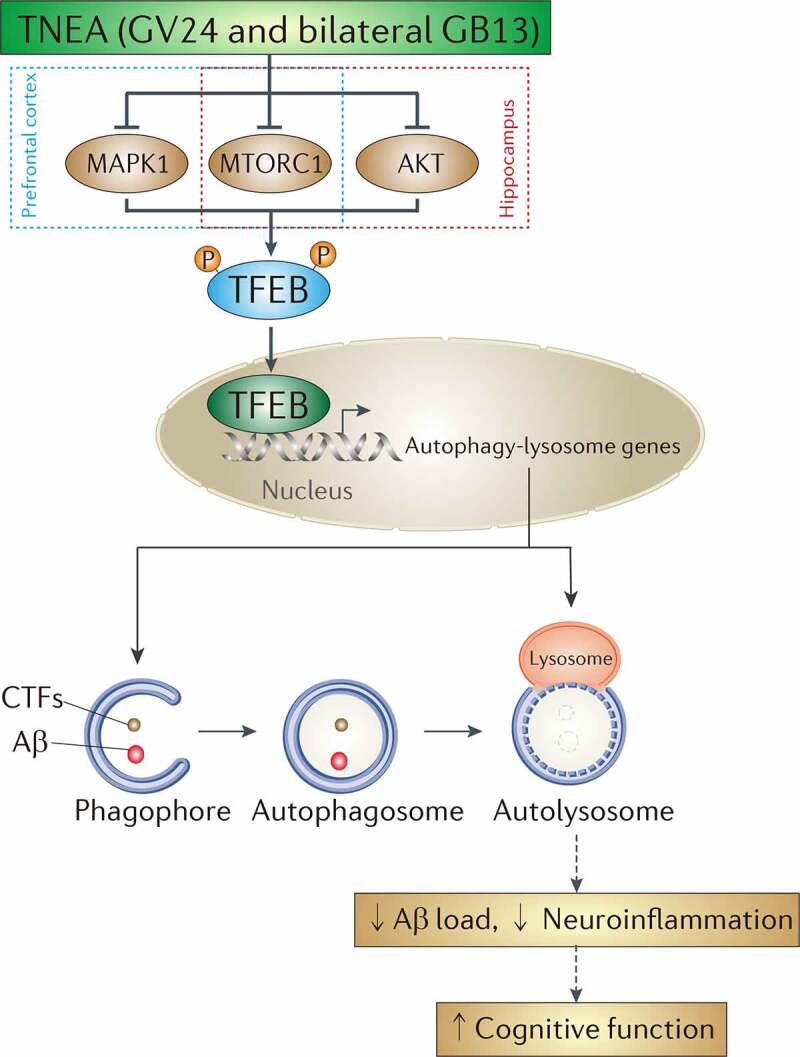
Alzheimer disease (AD) is the most prevalent neurodegenerative disorder leading to dementia in the elderly. Unfortunately, no cure for AD is available to date. Increasing evidence has proved the roles of misfolded protein aggregation due to impairment of the macroautophagy/autophagy-lysosomal pathway (ALP) in the pathogenesis of AD, and thus making TFEB (transcription factor EB), which orchestrates ALP, as a promising target for treating AD. As a complementary therapy, acupuncture or electroacupuncture (EA) has been commonly used for treating human diseases. Although the beneficial effects of acupuncture for AD have been primarily studied both pre-clinically and clinically, the real efficacy of acupuncture on AD remains inconclusive and the underlying mechanisms are largely unexplored. In this study, we demonstrated the cognitive-enhancing effect of three-needle EA (TNEA) in an animal model of AD with beta-amyloid (Aβ) pathology (5xFAD). TNEA reduced APP (amyloid beta (A4) precursor protein), C-terminal fragments (CTFs) of APP and Aβ load, and inhibited glial cell activation in the prefrontal cortex and hippocampus of 5xFAD. Mechanistically, TNEA activated TFEB via inhibiting the AKT-MAPK1-MTORC1 pathway, thus promoting ALP in the brains. Therefore, TNEA represents a promising acupuncture therapy for AD, via a novel mechanism involving TFEB activation.Abbreviations Aβ: β-amyloid; AD: Alzheimer disease; AIF1/IBA1: allograft inflammatory factor 1; AKT1: thymoma viral proto-oncogene 1; ALP: autophagy-lysosomal pathway; APP: amyloid beta (A4) precursor protein; BACE1: beta-site APP cleaving enzyme 1; CQ: chloroquine; CTFs: C-terminal fragments; CTSD: cathepsin D; EA: electroacupuncture; FC: fear conditioning; GFAP: glial fibrillary acidic protein; HI: hippocampus; LAMP1: lysosomal-associated membrane protein 1; MAP1LC3B/LC3B: microtubule-associated protein 1 light chain 3 beta; MAPK1/ERK2: mitogen-activated protein kinase 1; MAPT: microtubule-associated protein tau; MTORC1: mechanistic target of rapamycin kinase complex 1; MWM: Morris water maze; NFT: neurofibrillary tangles; PFC: prefrontal cortex; PSEN1: presenilin 1; SQSTM1/p62: sequestosome 1; TFEB: transcription factor EB; TNEA: three-needle electroacupuncture.

Keywords: Alzheimer disease; autophagy-lysosomal pathway; electroacupuncture; transcription factor EB.


Conflict of interest statement

The authors declare that they have no competing financial interests.

Figures

Figure 1.
Figure 1.
TNEA treatment improved spatial learning memory and contextual fear memory in 5XFAD mice. (A) Experimental procedures. EA: electroacupuncture; MWM: Morris water maze; FC: fear conditioning; WB: western blotting; IHC: immunohistochemistry. (B) EA treatment demonstrating the position of acupoints (GV24 and bilateral GB13), insertion of needles and connection to an electrical stimulator. (C-F) Morris water maze. (C) Representative moving patterns of mice in each group. (D) Quantification of escape latencies (mean ± SEM) in each group (male, n = 12–17). #p < 0.05, ##p < 0.01, ###p < 0.001 vs. wild-type (WT); *p < 0.05, **p < 0.01 vs. 5XFAD; 2-way ANOVA with Bonferroni multiple comparison test. (E) Quantification of times spent in the target quadrant (mean ± SEM, male, n = 12–17) during the probe trial. (F) Quantification of number of platform crossed (mean ± SEM, male, n = 12–17) during probe trial. ###p < 0.001 vs. WT, **p < 0.01 vs. 5XFAD analyzed by one‐way ANOVA. (G) Fear conditioning. The percentage of freezing in contextual and cued test was quantified (mean ± SEM, male, n = 12–17). ##p < 0.01 vs. WT, *p < 0.05 vs. 5XFAD analyzed by one-way ANOVA
Figure 2.
Figure 2.
TNEA treatment promoted the degradation of beta-amyloid precursor protein (APP) fragments in 5XFAD mice brains. Representative western blots showed the levels of full-length APP (Fl-APP), carboxy-terminal fragments (CTFs) and BACE1/β-secretase 1 in the prefrontal cortex (PFC) (A) and hippocampus (HI) (B) of mice brains. Data were quantified as mean ± SEM (male, n = 6). *p < 0.05, **p < 0.01 vs. 5XFAD group analyzed by Unpaired t test
Figure 3.
Figure 3.
TNEA treatment reduced Aβ load and inhibits microglia activation in 5XFAD mice brains. (A) Representative immunohistochemistry images of AIF1/IBA1 (green), Aβ (6E10, red) and DAPI (blue) in prefrontal cortex (PFC) and hippocampal CA1 of 7-month-old 5XFAD mice after EA treatment (scale bar: 50 μm). (B) Representative immunohistochemistry images of GFAP (green), Aβ1-42 (red) and DAPI (blue) in PFC and hippocampal CA1 of 7-month-old 5XFAD mice after EA (scale bar: 50 μm). (C) Aβ area, Aβ size, AIF1/IBA1 intensity, plaque associated microglia and GFAP intensity in PFC and CA1 were quantified as mean ± SEM (male, n = 7–8). *p < 0.05, **p < 0 .01 and ***p < 0.001 vs. 5XFAD group analyzed by Unpaired t test
Figure 4.
Figure 4.
TNEA treatment increased TFEB expression and activated autophagy-lysosomal pathway in 5XFAD mice brains. (A) Representative western blots showed the levels of autophagy markers (LC3B and SQSTM1) in the TX-100 soluble and insoluble fractions from the prefrontal cortex (PFC) and hippocampus (HI) of mice brains. (B, C) Data were quantified as mean ± SEM (male, n = 6). *p < 0.05, **p < 0.01 and ***p < 0.001 vs. 5XFAD group analyzed by Unpaired t test. (D) Representative western blots showed the levels of TFEB and lysosome markers (LAMP1 and CTSD) in the PFC and HI of mice brains. (E) Data were quantified as mean ± SEM (male, n = 6). *p < 0.05 and **p < 0.01 vs. 5XFAD group analyzed by Unpaired t test
Figure 5.
Figure 5.
TNEA-induced autophagy-lysosomal pathway in 5XFAD mice brains was blocked by chloroquine. 5XFAD mice were intraperitoneally injected with vehicle (PBS) or chloroquine (CQ, 50 mg/kg/day) 4 days before the last TNEA treatment. (A, C) Representative western blots showed the levels of autophagy markers (LC3B and SQSTM1 in the SDS soluble (A) and insoluble fractions (C) in the prefrontal cortex (PFC) and hippocampus (HI) of mice brains. SE, short exposure; LE, long exposure. (B, D) Data were quantified as mean ± SEM (male, n = 6) and analyzed by Unpaired t test. No statistical significance (p > 0.05) vs. CQ alone group. (E) Representative western blots showed the levels of LAMP1 in the HI and PFC of 5XFAD mice treated with/without CQ. (F) Data were quantified as mean ± SEM (male, n = 6) and analyzed by Unpaired t test. *p < 0.05 and ***p < 0.001 vs. TNEA group
Figure 6.
Figure 6.
TNEA treatment promoted the formation of autolysosomes in 5XFAD mice brains. Representative fluorescent images of LC3B (green) and CTSD (red) in the prefrontal cortex (PFC) (A) and hippocampal (HI) CA1 (B) of mice from wild-type (WT), 5XFAD and 5XFAD+TNEA groups. Original magnification: 60×, scale bar: 50 μm. Corresponding zoom-in images (scale bar: 25 μm) were processed using ImageJ to demonstrate the colocalization. The area of LC3B-positive CTSD was quantified as mean ± SEM (male, n = 3 to 5) and analyzed by one‐way ANOVA. *p < 0.05, **p < 0 .01 and ***p < 0.001 vs. 5XFAD group
Figure 7.
Figure 7.
TNEA treatment promoted the dephosphorylation and nuclear translocation of TFEB in 5XFAD mice brains. (A, B) Representative western blots and quantification showed the levels of the cytosolic (Cyt) and nuclear (Nuc) TFEB in the prefrontal cortex (PFC) and hippocampus (HI) of mice brains. GAPDH and H3F3A were used as cytosolic and nuclear loading controls respectively. Data were quantified as mean ± SEM (male, n = 6). *p < 0.05, vs. 5XFAD group analyzed by Unpaired t test. Another batch of blots was shown in Figure S2. (C) Representative western blots and quantification showed the levels of phosphorylated (p-) TFEB (S142) in the PFC and HI of mice brains. Data were quantified as mean ± SEM (male, n = 6). **p < 0.01 and ***p < 0.001 vs. 5XFAD group analyzed by unpaired t test
Figure 8.
Figure 8.
TNEA treatment restored the defective recognition and degradation of autophagy substrates in 5XFAD mice brains. (A, B) Representative fluorescent images of LC3B (green) and Aβ42 (red) in prefrontal cortex (PFC) (A) and hippocampal (HI) CA1 (B) of mice from 5XFAD and 5XFAD+TNEA groups. Original magnification: 60×, scale bar: 50 μm. Corresponding zoom-in images (scale bar: 25 μm) were processed using ImageJ to demonstrate the colocalization. The area of LC3B and Aβ42 colocalization was quantified as mean ± SEM (male, n = 6) and analyzed by unpaired t test. **p < 0 .01 vs. 5XFAD group. (C, D) Representative fluorescence images of SQSTM1 (green) and APP/Aβ (6E10, red) in PFC (C) and CA1 (D) of mice from 5XFAD and 5XFAD+TNEA groups. Original magnification: 20×, scale bar: 200 μm. Corresponding zoom-in images (scale bar: 100 μm) were processed using ImageJ to demonstrate the colocalization. The area of plaque-associated SQSTM1 was quantified as mean ± SEM (male, n = 5 to 6) and analyzed by unpaired t test. *p < 0 .05 vs. 5XFAD group
Figure 9.
Figure 9.
TNEA treatment reduced Aβ plaque-associated LAMP1 in 5XFAD mice brains. Representative fluorescent images of LAMP1 (green), APP/Aβ (6E10, red) and DAPI (blue) in the prefrontal cortex (PFC) (A) and hippocampal (HI) CA1 (B) of mice from WT, 5XFAD and 5XFAD+TNEA groups. Original magnification: 20×, scale bar: 200 μm. Corresponding zoom-in images (scale bar: 100 μm) were processed using ImageJ to demonstrate the colocalization. The area of plaque-associated LAMP1 was quantified as mean ± SEM (male, n = 5 to 6) and analyzed by unpaired t test. *p < 0 .05 and **p < 0.01 vs. 5XFAD group
Figure 10.
Figure 10.
TFEB-induced lysosomal activation was required for memory improvement and APP/CTFs degradation induced by TNEA in 5XFAD mice. (A) Representative western blots showed the levels of full-length APP (Fl-APP) in the hippocampus of mice brains. (B) Data were quantified as mean ± SEM (n = 4) and analyzed by one-way ANOVA. **p < 0.01 and ***p < 0.001 vs. 5XFAD +TNEA group. (C) Morris water maze. Quantification of times spent in the target quadrant and number of platform crossed (mean ± SEM, n = 8–11) during probe trial. *p < 0.05 and **p < 0 .01 vs. 5XFAD+TNEA group analyzed by one‐way ANOVA. (D) Fear conditioning. The percentage of freezing in contextual and cued test was quantified (mean ± SEM, n = 8–11). *p < 0.05, **p < 0.01 and ***p < 0.001 vs. 5XFAD+TNEA group analyzed by one‐way ANOVA. (E) Representative western blots showed the levels of full-length APP and carboxy-terminal fragments (CTFs) in the hippocampus of mice brains. (F) Relative levels of CTFs were quantified as mean ± SEM (male, n = 3). (G) Morris water maze. Quantification of number of platform crossed (mean ± SEM, n = 4–6) during probe trial. *p < 0.05 vs. sh-Scramble +TNEA group analyzed by one-way ANOVA
Figure 11.
Figure 11.
TNEA treatment inhibited MTORC1, AKT and MAPK1 in 5XFAD mice brains. Representative western blots and quantification showed the levels of phosphorylated (p-) and total MTOR, RPS6, AKT and MAPK1 in the prefrontal cortex (PFC) (A) and hippocampus (HI) (B) of mice brains. Data were quantified as mean ± SEM (male, n = 6). *p < 0.05 and **p < 0.01 vs. 5XFAD group respectively analyzed by unpaired t test
Figure 12.
Figure 12.
A mechanistic model showed that TNEA attenuates cognitive impairment in AD involving the activation of TFEB. EA (GV24 and bilateral GB13) treatment inhibits MTORC1 and MAPK1 in the prefrontal cortex, and inhibits MTORC1 and AKT in the hippocampus respectively, thus promoting the dephosphorylation and nuclear translocation and of TFEB to transcriptionally upregulate the autophagy-lysosomal pathway, which is essential for the degradation of Aβ and carboxy-terminal fragments (CTFs)

References

    1. Li C, Gotz J.. Tau-based therapies in neurodegeneration: opportunities and challenges. Nat Rev Drug Discov. 2017;16(12):863–883. - PubMed
    1. Mullard A. Alzheimer amyloid hypothesis lives on. Nat Rev Drug Discov. 2016;16(1):3–5. - PubMed
    1. Settembre C, Di Malta C, Polito VA, et al. TFEB links autophagy to lysosomal biogenesis. Science. 2011;332(6036):1429–1433. - PMC - PubMed
    1. Sardiello M, Palmieri M, di Ronza A, et al. A gene network regulating lysosomal biogenesis and function. Science. 2009;325(5939):473–477. - PubMed
    1. Puertollano R, Ferguson SM, Brugarolas J, et al. The complex relationship between TFEB transcription factor phosphorylation and subcellular localization. Embo J. 2018;37(11):e98804. - PMC - PubMed

Publication types

MeSH terms

Substances