

Systematic analysis of the expression and prognosis relevance of FBXO family reveals the significance of FBXO1 in human breast cancer
- PMID: 33622332
- PMCID: PMC7903729
- DOI: 10.1186/s12935-021-01833-y
Systematic analysis of the expression and prognosis relevance of FBXO family reveals the significance of FBXO1 in human breast cancer
Abstract
Background: Breast cancer (BC) remains a prevalent and common form of cancer with high heterogeneity. Making efforts to explore novel molecular biomarkers and serve as potential disease indicators, which is essential to effectively enhance the prognosis and individualized treatment of BC. FBXO proteins act as the core component of E3 ubiquitin ligase, which play essential regulators roles in multiple cellular processes. Recently, research has indicated that FBXOs also play significant roles in cancer development. However, the molecular functions of these family members in BC have not been fully elucidated.
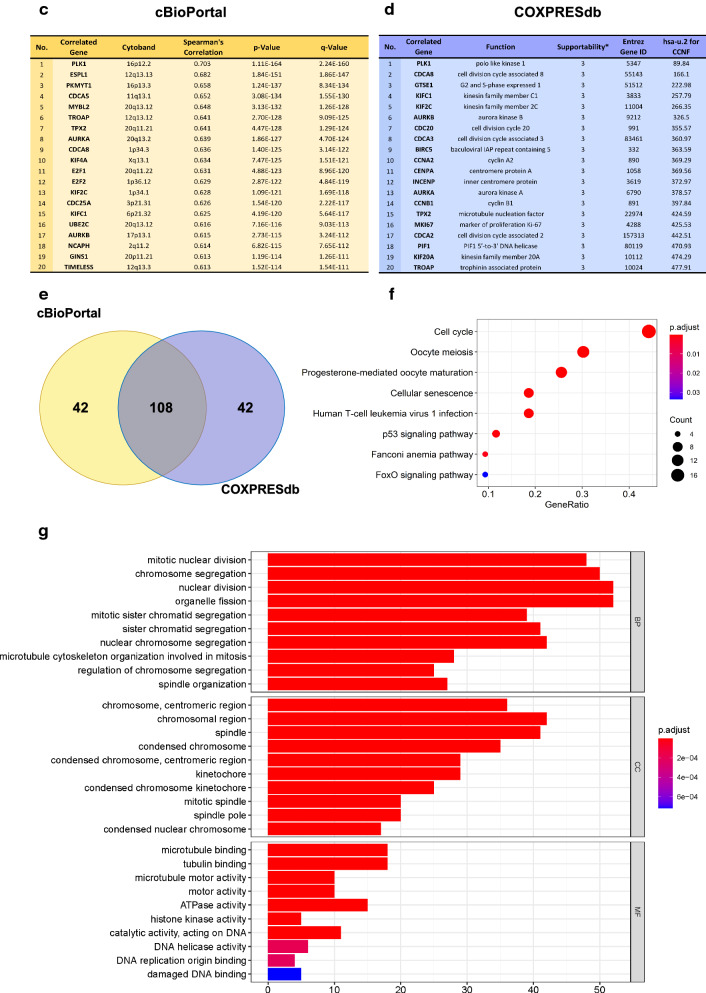
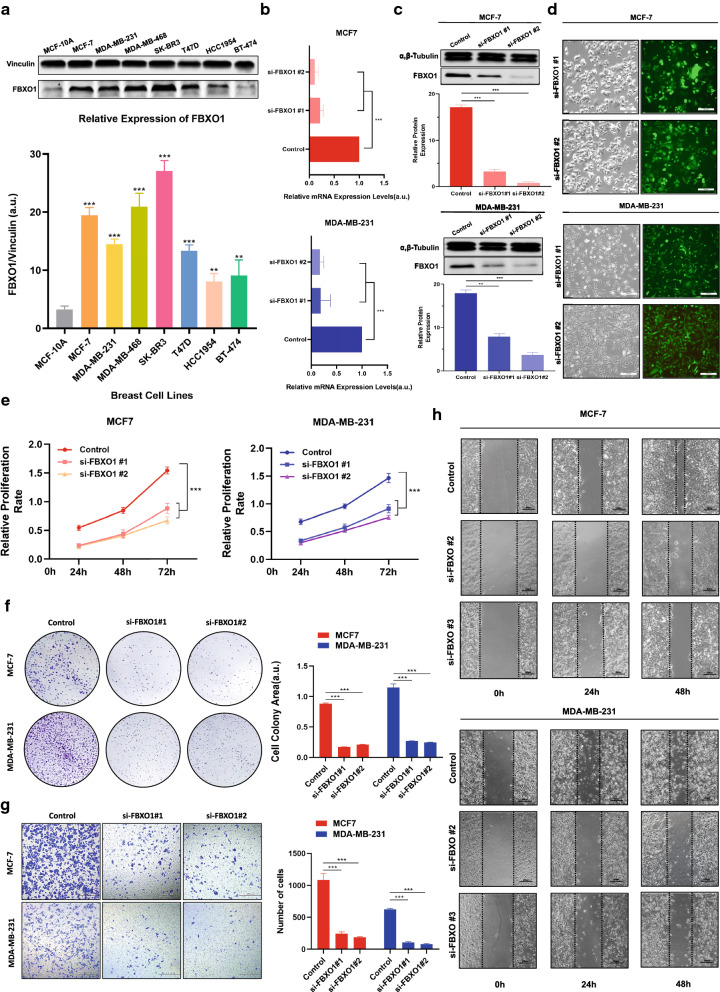
Methods: In this research, we investigated the expression data, survival relevance and mutation situation of 10 FBXO members (FBXO1, 2, 5, 6, 16, 17, 22, 28, 31 and 45) in patients with BC from the Oncomine, GEPIA, HPA, Kaplan-Meier Plotter, UALCAN and cBioPortal databases. The high transcriptional levels of FBXO1 in different subtypes of BC were verified by immunohistochemical staining and the specific mutations of FBXO1 were obtained from COSMIC database. Top 10 genes with the highest correlation to FBXO1 were identified through cBioPortal and COXPRESdb tools. Additionally, functional enrichment analysis, PPI network and survival relevance of FBXO1 and co-expressed genes in BC were obtained from DAVID, STRING, UCSC Xena, GEPIA, bc-GenExMiner and Kaplan-Meier Plotter databases. FBXO1 siRNAs were transfected into MCF-7 and MDA-MB-231 cell lines. Expression of FBXO1 in BC cell lines was detected by western-blot and RT-qPCR. Cell proliferation was detected by using CCK-8 kit and colony formation assay. Cell migration was detected by wound-healing and transwell migration assay.
Results: We found that FBXO2, FBXO6, FBXO16 and FBXO17 were potential favorable prognostic factors for BC. FBXO1, FBXO5, FBXO22, FBXO28, FBXO31 and FBXO45 may be the independent poor prognostic factors for BC. All of them were correlated to clinicopathological staging. Moreover, knockdown of FBXO1 in MCF7 and MDA-MB-231 cell lines resulted in decreased cell proliferation and migration in vitro. We identified that FBXO1 was an excellent molecular biomarker and therapeutic target for different molecular typing of BC.
Conclusion: This study implies that FBXO1, FBXO2, FBXO5, FBXO6, FBXO16, FBXO17, FBXO22, FBXO28, FBXO31 and FBXO45 genes are potential clinical targets and prognostic biomarkers for patients with different molecular typing of BC. In addition, the overexpression of FBXO1 is always found in breast cancer and predicts disadvantageous prognosis, implicating it could as an appealing therapeutic target for breast cancer patients.
Keywords: Bioinformatics analysis; Biomarkers; Breast cancer; F-box protein; Prognosis.
Conflict of interest statement
The authors declare that they have no competing interests.
Figures


Similar articles
-
Comprehensive Analysis of Expression, Prognostic Value, and Immune Infiltration for Ubiquitination-Related FBXOs in Pancreatic Ductal Adenocarcinoma.Front Immunol. 2022 Jan 3;12:774435. doi: 10.3389/fimmu.2021.774435. eCollection 2021. Front Immunol. 2022. PMID: 35046938 Free PMC article.
-
Clinicopathological Significances of Cancer Stem Cell-Associated HHEX Expression in Breast Cancer.Front Cell Dev Biol. 2020 Dec 23;8:605744. doi: 10.3389/fcell.2020.605744. eCollection 2020. Front Cell Dev Biol. 2020. PMID: 33425911 Free PMC article.
-
Screening of the novel immune-suppressive biomarkers of TMED family and whether knockdown of TMED2/3/4/9 inhibits cell migration and invasion in breast cancer.Ann Transl Med. 2022 Dec;10(23):1280. doi: 10.21037/atm-22-5444. Ann Transl Med. 2022. PMID: 36618780 Free PMC article.
-
Prognostic values of F-box members in breast cancer: an online database analysis and literature review.Biosci Rep. 2019 Jan 3;39(1):BSR20180949. doi: 10.1042/BSR20180949. Print 2019 Jan 31. Biosci Rep. 2019. PMID: 30341246 Free PMC article. Review.
-
Analysis of the Expression of Cell Division Cycle-Associated Genes and Its Prognostic Significance in Human Lung Carcinoma: A Review of the Literature Databases.Biomed Res Int. 2020 Feb 12;2020:6412593. doi: 10.1155/2020/6412593. eCollection 2020. Biomed Res Int. 2020. PMID: 32104702 Free PMC article. Review.
Cited by
-
KLF9‑regulated FBXO31 inhibits the progression of endometrial cancer and enhances the sensitivity of endometrial cancer cells to cisplatin.Exp Ther Med. 2023 Dec 5;27(2):54. doi: 10.3892/etm.2023.12342. eCollection 2024 Feb. Exp Ther Med. 2023. PMID: 38234628 Free PMC article.
-
Expression of Genomic Instability-Related Molecules: Cyclin F, RRM2 and SPDL1 and Their Prognostic Significance in Pancreatic Adenocarcinoma.Cancers (Basel). 2021 Feb 18;13(4):859. doi: 10.3390/cancers13040859. Cancers (Basel). 2021. PMID: 33670609 Free PMC article.
-
SCF-FBXL8 contributes to liver metastasis and stem-cell-like features in colorectal cancer cells by mediating ubiquitination and degradation of TP53.Clin Transl Med. 2023 Mar;13(3):e1208. doi: 10.1002/ctm2.1208. Clin Transl Med. 2023. PMID: 36855778 Free PMC article.
-
Identification of SNPs and Candidate Genes for Milk Production Ability in Yorkshire Pigs.Front Genet. 2021 Oct 5;12:724533. doi: 10.3389/fgene.2021.724533. eCollection 2021. Front Genet. 2021. PMID: 34675963 Free PMC article.
-
Screening and prognostic value of potential biomarkers for ovarian cancer.Ann Transl Med. 2021 Jun;9(12):1007. doi: 10.21037/atm-21-2627. Ann Transl Med. 2021. PMID: 34277807 Free PMC article.
References
-
- Bray F, Ferlay J, Soerjomataram I, et al. Global cancer statistics 2018: GLOBOCAN estimates of incidence and mortality worldwide for 36 cancers in 185 countries. CA Cancer J Clin. 2018;68(6):394–424. - PubMed
Grants and funding
LinkOut - more resources
Full Text Sources
Other Literature Sources
Miscellaneous
