. 2021 Feb 23;9(1):54.
doi: 10.1186/s40168-020-00986-8.

Acquisition of oral microbiota is driven by environment, not host genetics

Affiliations

Acquisition of oral microbiota is driven by environment, not host genetics

Chiranjit Mukherjee et al. Microbiome. .

Abstract

Background: The oral microbiota is acquired very early, but the factors shaping its acquisition are not well understood. Previous studies comparing monozygotic (MZ) and dizygotic (DZ) twins have suggested that host genetics plays a role. However, all twins share an equal portion of their parent's genome, so this model is not informative for studying parent-to-child transmission. We used a novel study design that allowed us to directly examine the genetics of transmission by comparing the oral microbiota of biological versus adoptive mother-child dyads.

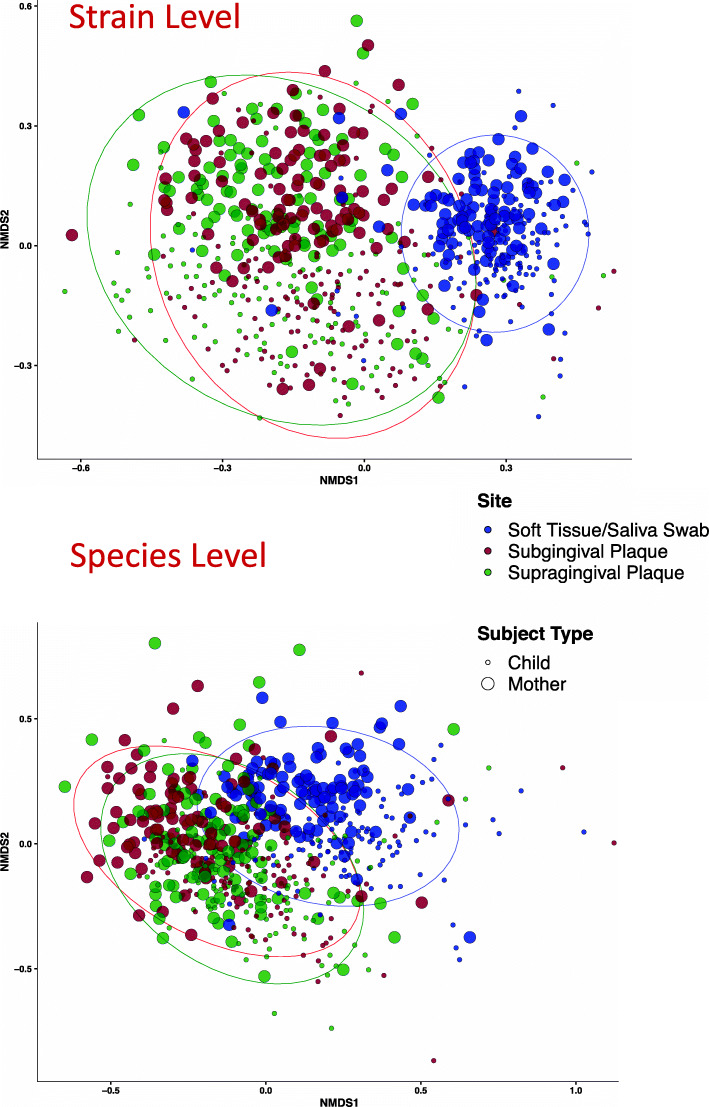
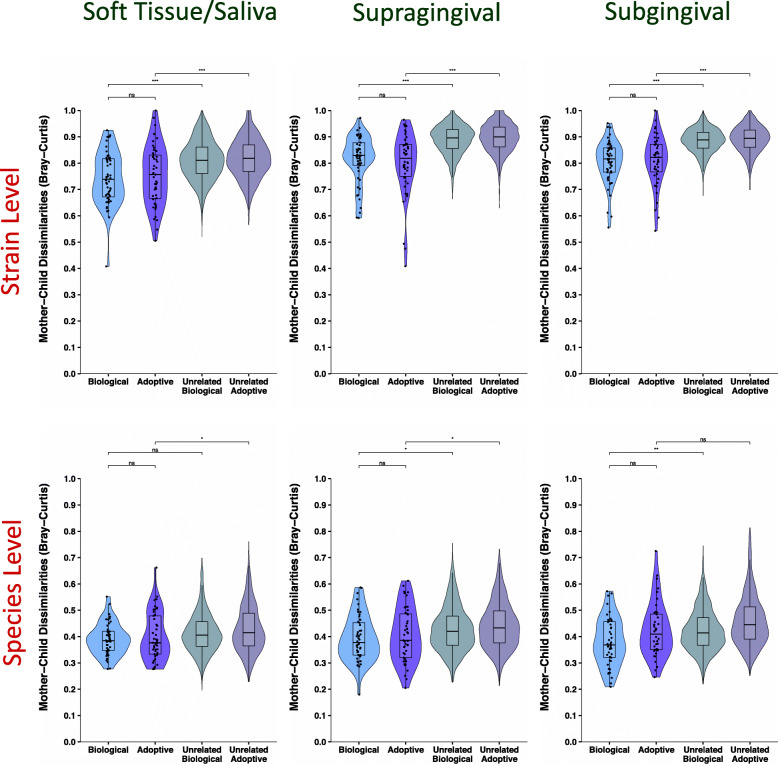
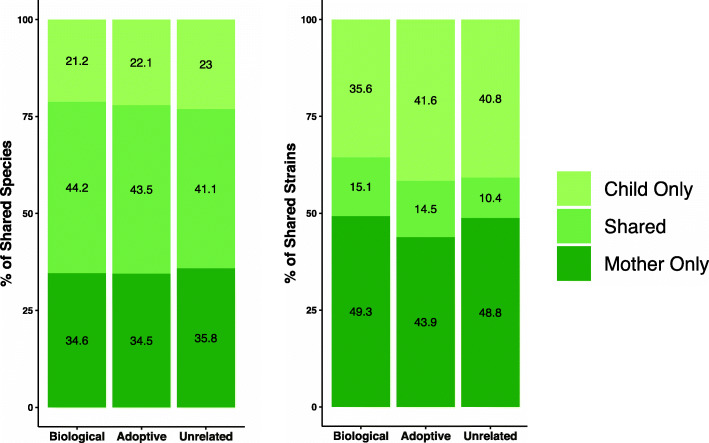
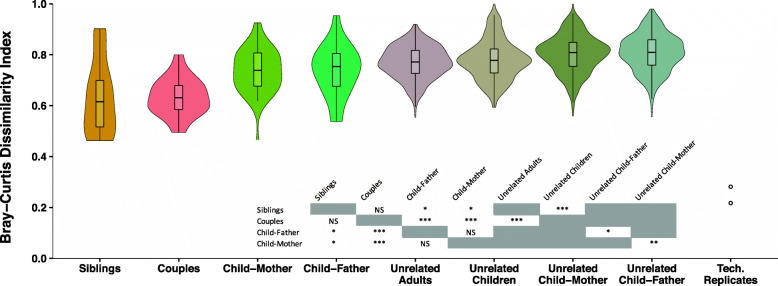
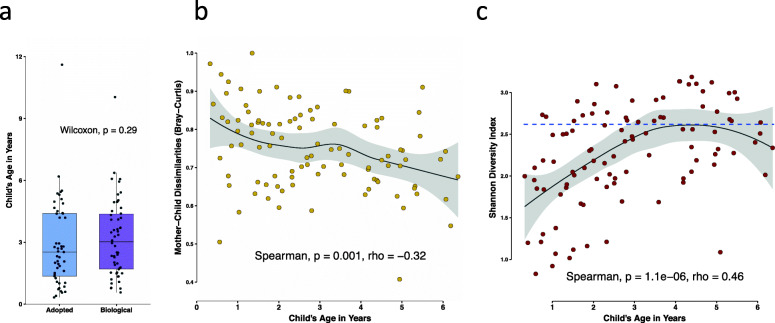
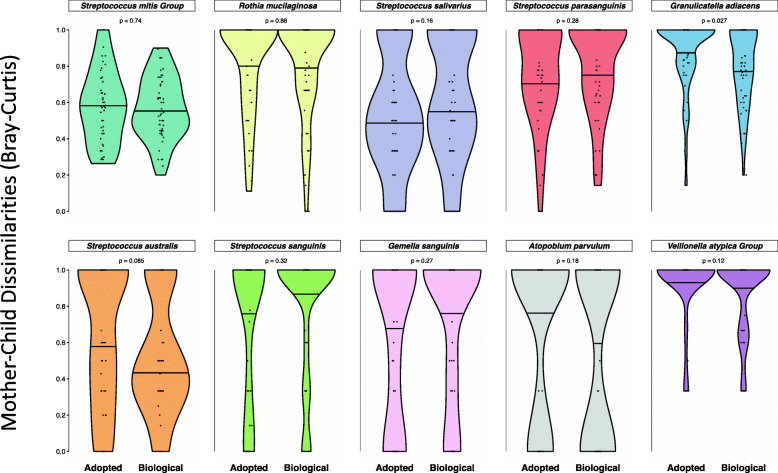
Results: No difference was observed in how closely oral bacterial community profiles matched for adoptive versus biological mother-child pairs, indicating little if any effect of host genetics on the fidelity of transmission. Both adopted and biologic children more closely resembled their own mother as compared to unrelated women, supporting the role of contact and environment. Mother-child strain similarity increased with the age of the child, ruling out early effects of host genetic influence that are lost over time. No effect on the fidelity of mother-child strain sharing from vaginal birth or breast feeding was seen. Analysis of extended families showed that fathers and mothers were equally similar to their children, and that cohabitating couples showed even greater strain similarity than mother-child pairs. These findings support the role of contact and shared environment, and age, but not genetics, as determinants of microbial transmission, and were consistent at both species and strain level resolutions, and across multiple oral habitats. In addition, analysis of individual species all showed similar results.

Conclusions: The host is clearly active in shaping the composition of the oral microbiome, since only a few of the many bacterial species in the larger environment are capable of colonizing the human oral cavity. Our findings suggest that these host mechanisms are universally shared among humans, since no effect of genetic relatedness on fidelity of microbial transmission could be detected. Instead our findings point towards contact and shared environment being the driving factors of microbial transmission, with a unique combination of these factors ultimately shaping the highly personalized human oral microbiome. Video abstract.

Keywords: Acquisition; Genetics; Human; Oral microbiome; Strain level; Transmission.


Conflict of interest statement

The authors declare that they have no competing interests.

Figures

Fig. 1
Fig. 1
Overview of the multi-habitat and multi-resolution approach to compare microbial profiles. Adoptive and biological mother-child pairs were the main comparison groups. In addition, siblings and fathers in the biological group were recruited. Three distinct microbial habitats within the oral cavity were sampled–soft tissue and saliva, supragingival plaque, and subgingival plaque. For profiling species-level communities, amplicon sequencing targeting the 16S V1-V3 region was performed. For strain-level profiling, amplicon sequencing of the 16-23S Intergenic Spacer Region (ISR) was performed (see “Methods” section)
Fig. 2
Fig. 2
Beta-diversity comparison among samples by subject type and sampling site, at both species and strain levels. Non-metric multidimensional scaling (NMDS) plots using Bray-Curtis dissimilarities based on community membership, at ISR-strain level (top panel) and 16S Species level (bottom panel) are shown. At the lower resolution (species level) inter-sample distances are smaller as compared to strain level. Ellipses are drawn to show 95% confidence intervals for each group
Fig. 3
Fig. 3
No influence of genetics on sharing of strains or species between mother and child. Violin plots with embedded box and whisker plots are shown here comparing the distribution of mother-child distances in the biological, adoptive, unrelated biological, and unrelated adoptive groups, for the three sampling sites, at strain (top panel) and species level (bottom panel). No significant difference was observed in the mother-child dissimilarities for the biological and adoptive groups, at either species or strain levels, across the 3 distinct habitats within the oral cavity. Biological vs adoptive statistical comparisons were performed using Wilcoxon rank sum test, and related/unrelated comparisons were performed using a comparable permutation-based test (see “Methods” section). Significance levels: ns: p > 0.05, *p ≤ 0.05, **p ≤ 0.01, ***p ≤ 0.001
Fig. 4
Fig. 4
Adopted and biological mother-child pairs shared similar percentage of species and strains. Stacked bar plots showing mean number of species-OTUs (left) and ISR-strains (right) shared by mother-child pairs in the adoptive, biological and combined unrelated groups for the saliva/soft tissue swab samples. The percentages of shared species/strains were comparable for the adoptive and biological groups at both resolutions
Fig. 5
Fig. 5
Shared environment led to greater similarity between individual’s oral microbial communities at strain level. Comparing microbial community similarities among different family groups, based on saliva/soft tissue swab samples from the extended biological family dataset. Dissimilarities between individuals were lowest among cohabitating couples and siblings, even compared to child-mother and child-father. Children’s oral microbiota were equally similar to their father’s, as they were to their mother’s. Couples and siblings were more similar to themselves, compared to unrelated adults and unrelated children, respectively. Technical replicates were highly similar to one another. Statistical comparisons were performed using Wilcoxon rank sum test and the previously used permutation test (when including unrelated groups)
Fig. 6
Fig. 6
Child’s age was a significant determinant of mother-child dissimilarities. a Box and whisker plot showing distribution of ages among the biologic and adoptive group children. b Scatterplot exhibiting the relationship of mother-child distances with age of the child. A strong negative correlation between mother-child dissimilarities and child’s age was observed. Both adoptive and biologic children were included in this analysis, and two older children (>= 10 years) were excluded (n = 101). c For the same 101 children, the alpha diversity measure Shannon diversity index was plotted against age. The blue dotted line represents mean Shannon diversity for mothers of those children. Alpha diversity also showed strong positive correlation with child’s age, and most older children’s diversities were similar to the adults. Strength and direction of associations were measured using Spearman’s rank-order test. Scatter plots were smoothed using the regression method LOESS fit. Analysis was based on strain level communities
Fig. 7
Fig. 7
No influence of genetics on mother-child distances for individual species. Violin plots comparing the distribution of mother-child dissimilarities in the biologic and adoptive groups. For the 10 most abundant species, Bray-Curtis dissimilarities were generated based on presence/absence of strains for each species. Mother-child distances (dissimilarities) were not significantly different between the adoptive and biologic groups for any species. Wilcoxon rank sum test was used for statistical comparisons, and p values generated were corrected for false positives (Benjamini-Hochberg procedure) to generate q values shown. The 50th quantile of each distribution is marked for comparison. Data is based on the saliva/soft tissue swab samples

References

    1. Huttenhower C, et al. Structure, function and diversity of the healthy human microbiome. Nature. 2012;486:207–214. doi: 10.1038/nature11234. - DOI - PMC - PubMed
    1. Dewhirst FE, et al. The human oral microbiome. J Bacteriol. 2010;192:5002–5017. doi: 10.1128/JB.00542-10. - DOI - PMC - PubMed
    1. Sulyanto RM, Thompson ZA, Beall CJ, Leys EJ, Griffen AL. The predominant oral microbiota is acquired early in an organized pattern. Sci Rep. 2019;9:10550. doi: 10.1038/s41598-019-46923-0. - DOI - PMC - PubMed
    1. Lloyd-Price J, et al. Strains, functions and dynamics in the expanded human microbiome project. Nature. 2017;550:61–66. doi: 10.1038/nature23889. - DOI - PMC - PubMed
    1. Mukherjee C, Beall CJ, Griffen AL, Leys EJ. High-resolution ISR amplicon sequencing reveals personalized oral microbiome. Microbiome. 2018;6:153. doi: 10.1186/s40168-018-0535-z. - DOI - PMC - PubMed

Publication types

LinkOut - more resources