Transcranial Focused Ultrasound Enhances Sensory Discrimination Capability through Somatosensory Cortical Excitation
- PMID: 33622622
- PMCID: PMC8011531
- DOI: 10.1016/j.ultrasmedbio.2021.01.025
Transcranial Focused Ultrasound Enhances Sensory Discrimination Capability through Somatosensory Cortical Excitation
Abstract
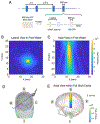
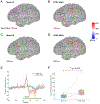
Low-intensity transcranial focused ultrasound (tFUS) has emerged as a non-invasive brain neuromodulation tool with high spatial specificity. Previous studies attributed tFUS-enhanced sensory performance to the ultrasound-induced inhibitory neural effects. However, to date there is no direct evidence validating the neural mechanism underlying ultrasound-mediated somatosensory enhancement. In this study, healthy human subjects (N = 9) were asked to perform tactile vibration frequency discrimination tasks while tFUS was directed onto the primary somatosensory cortex. During this task, we simultaneously recorded 64-channel electroencephalography (EEG) signals and investigated the brain responses at both EEG sensors and source domains by means of electrophysiological source imaging (ESI). The behavioral results indicated that the subjects' discrimination ability was improved by tFUS with an increased percentage of correct responses. EEG and ESI results revealed that tFUS neuromodulation was able to improve sensory discrimination capability through excitatory effects at the targeted sensory cortex.
Keywords: Electrophysiological source imaging; Neuromodulation; Sensory discrimination; Somatosensory evoked potential; Transcranial focused ultrasound.
Copyright © 2021 World Federation for Ultrasound in Medicine & Biology. Published by Elsevier Inc. All rights reserved.
Conflict of interest statement
Conflict of interest The authors declare no competing interests.
Figures


Similar articles
-
Transcranial focused ultrasound modulates intrinsic and evoked EEG dynamics.Brain Stimul. 2014 Nov-Dec;7(6):900-8. doi: 10.1016/j.brs.2014.08.008. Epub 2014 Sep 6. Brain Stimul. 2014. PMID: 25265863 Clinical Trial.
-
Transcranial focused ultrasound modulates the activity of primary somatosensory cortex in humans.Nat Neurosci. 2014 Feb;17(2):322-9. doi: 10.1038/nn.3620. Epub 2014 Jan 12. Nat Neurosci. 2014. PMID: 24413698
-
Neuromodulation with single-element transcranial focused ultrasound in human thalamus.Hum Brain Mapp. 2018 May;39(5):1995-2006. doi: 10.1002/hbm.23981. Epub 2018 Jan 29. Hum Brain Mapp. 2018. PMID: 29380485 Free PMC article.
-
A review of functional neuromodulation in humans using low-intensity transcranial focused ultrasound.Biomed Eng Lett. 2024 Mar 2;14(3):407-438. doi: 10.1007/s13534-024-00369-0. eCollection 2024 May. Biomed Eng Lett. 2024. PMID: 38645585 Free PMC article. Review.
-
Transcranial Focused Ultrasound Neuromodulation in Psychiatry: Main Characteristics, Current Evidence, and Future Directions.Brain Sci. 2024 Oct 30;14(11):1095. doi: 10.3390/brainsci14111095. Brain Sci. 2024. PMID: 39595858 Free PMC article. Review.
Cited by
-
Excitatory-inhibitory modulation of transcranial focus ultrasound stimulation on human motor cortex.CNS Neurosci Ther. 2023 Dec;29(12):3829-3841. doi: 10.1111/cns.14303. Epub 2023 Jun 12. CNS Neurosci Ther. 2023. PMID: 37309308 Free PMC article.
-
Neuromodulation with Ultrasound: Hypotheses on the Directionality of Effects and Community Resource.medRxiv [Preprint]. 2025 Feb 21:2024.06.14.24308829. doi: 10.1101/2024.06.14.24308829. medRxiv. 2025. PMID: 38947047 Free PMC article. Preprint.
-
A Comprehensive Review of Low-Intensity Focused Ultrasound Parameters and Applications in Neurologic and Psychiatric Disorders.Neuromodulation. 2025 Jan;28(1):1-15. doi: 10.1016/j.neurom.2024.07.008. Epub 2024 Sep 4. Neuromodulation. 2025. PMID: 39230530 Free PMC article. Review.
-
Transcranial ultrasound stimulation of the human motor cortex.iScience. 2021 Nov 13;24(12):103429. doi: 10.1016/j.isci.2021.103429. eCollection 2021 Dec 17. iScience. 2021. PMID: 34901788 Free PMC article.
-
Advanced rehabilitation in ischaemic stroke research.Stroke Vasc Neurol. 2024 Aug 27;9(4):328-343. doi: 10.1136/svn-2022-002285. Stroke Vasc Neurol. 2024. PMID: 37788912 Free PMC article. Review.
References
-
- Babiloni F, Cincotti F, Babiloni C, Carducci F, Mattia D, Astolfi L, Basilisco A, Rossini PM, Ding L, Ni Y, Cheng J, Christine K, Sweeney J and He B Estimation of the cortical functional connectivity with the multimodal integration of high-resolution EEG and fMRI data by directed transfer function. Neuroimage 2005;24:118–131. - PubMed
-
- Dale AM, Fischl B and Sereno MI Cortical surface-based analysis. I. Segmentation and surface reconstruction. Neuroimage 1999;9:179–194. - PubMed
-
- Dale AM and Sereno MI Improved localization of cortical activity by combining EEG and MEG with MRI cortical surface reconstruction: a linear approach. J. Cognitive Neuroscience 1993;5:162–176. - PubMed
Publication types
MeSH terms
Grants and funding
LinkOut - more resources
Full Text Sources
Other Literature Sources

