. 2021 May 1;27(9):2636-2647.
doi: 10.1158/1078-0432.CCR-20-4226. Epub 2021 Feb 23.

Molecular Features of Cancer-associated Fibroblast Subtypes and their Implication on Cancer Pathogenesis, Prognosis, and Immunotherapy Resistance

Affiliations

Molecular Features of Cancer-associated Fibroblast Subtypes and their Implication on Cancer Pathogenesis, Prognosis, and Immunotherapy Resistance

Phillip M Galbo Jr et al. Clin Cancer Res. .

Abstract

Purpose: Cancer-associated fibroblasts (CAFs) are an important component of the tumor microenvironment, but a systematic investigation of their molecular characteristics and clinical relevance are lacking. Here, we sought to compare CAFs across multiple cancer types to identify critical molecular pathways activated in CAF subtypes, which may contribute to clinical outcome, disease progression, and immunotherapy resistance.

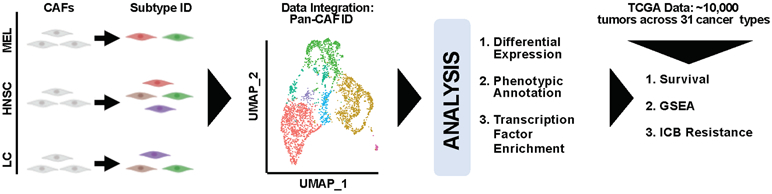
Experimental design: We performed integrated analysis of CAFs from melanoma, head and neck squamous cell carcinoma, and lung cancer, and identified the molecular characteristics that are distinctly active in each CAF subtype. Gene signatures for individual CAF subtypes were identified and used to study the association of subtype abundance with clinical outcome and immunotherapy resistance.

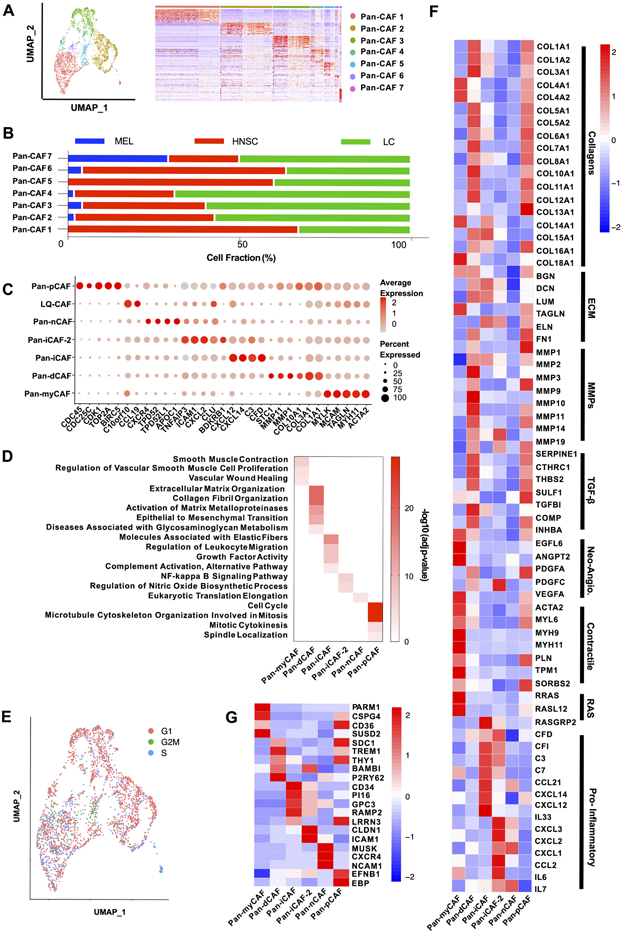
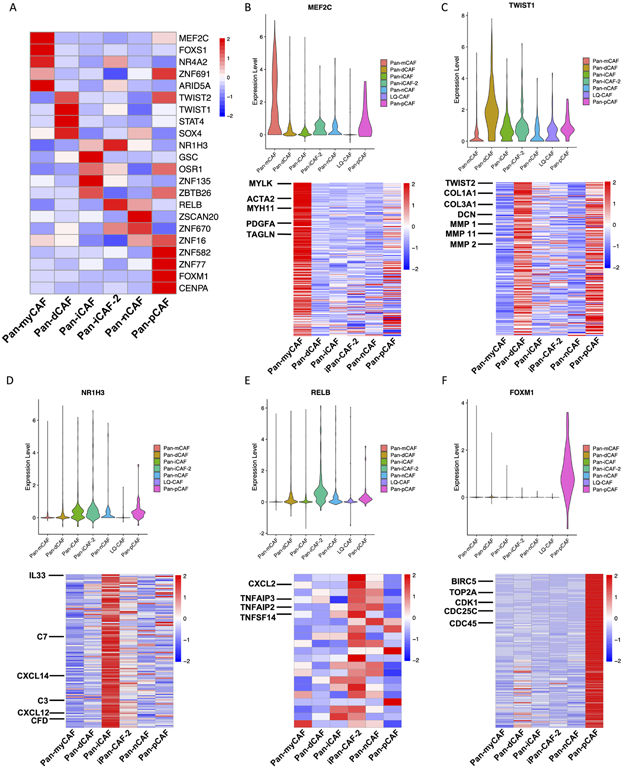
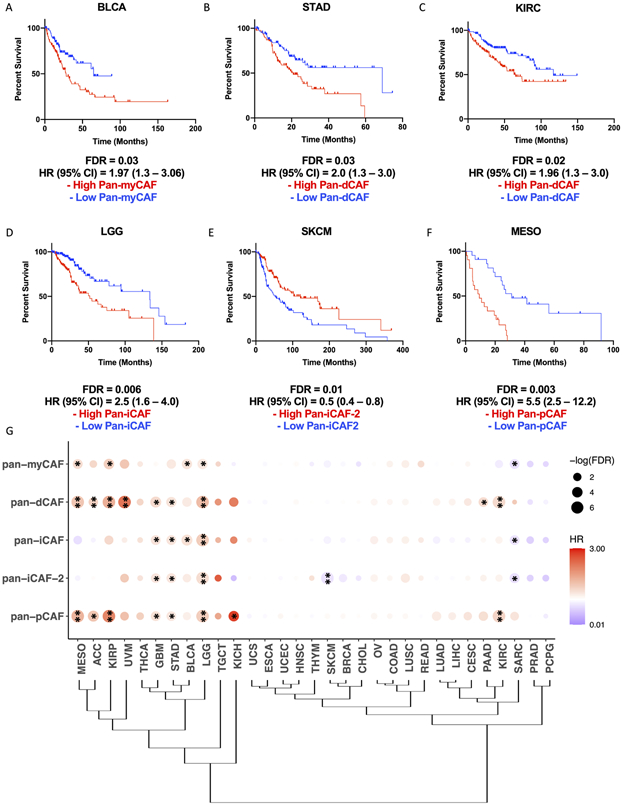
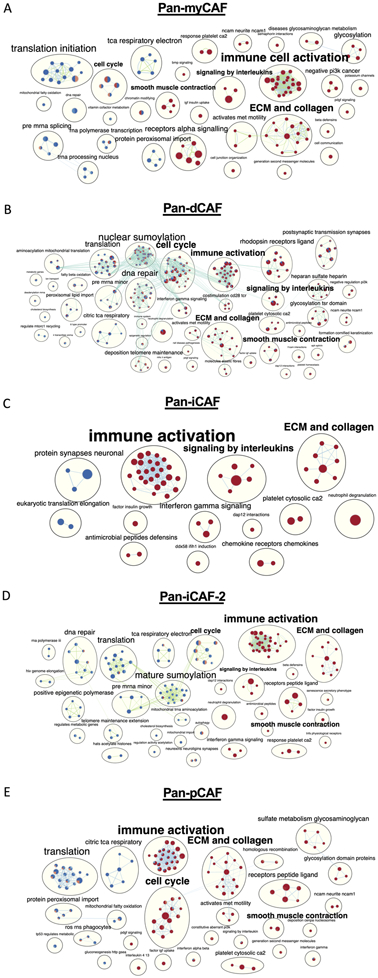
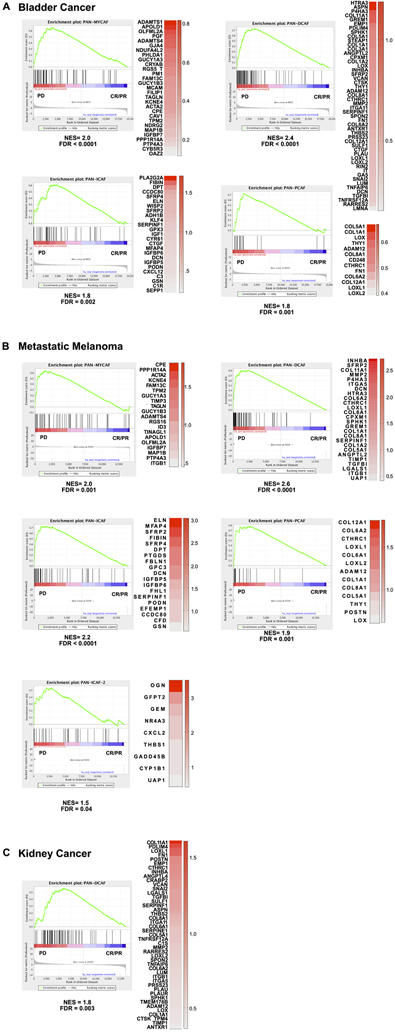
Results: We identified six CAF subtypes (pan-CAF) shared across cancer types and uncovered the molecular characteristics and genetic pathways distinguishing them. Interestingly, these CAF subtypes express distinct immunosuppressive factors, such as CXCL12 and CXLC14, and stem cell-promoting factor IL6. In addition, we identified novel transcriptional drivers (MEF2C, TWIST1, NR1H3, RELB, and FOXM1) key to CAF heterogeneity. Furthermore, we showed that CAF subtypes were associated with different clinical outcomes and uncovered key molecular pathways that could activate or suppress cancer progression or were involved in resistance to anti-PD1 or anti-PD-L1 immunotherapy.

Conclusions: Our study identifies the molecular characteristics of CAF subtypes shared across several cancer types, implicates cancer types that may benefit from CAF subtype targeted therapies, and identifies specific CAF subtypes associated with immunotherapy resistance.


Conflict of interest statement

Conflict of Interest: None to declare

Figures

Figure 1.
Figure 1.. Schematic illustration of our experimental design and analytic approaches.
Figure 2.
Figure 2.. Marker genes and biological processes for pan-CAF subtypes.
(A) UMAP (left) depicting subtypes and heatmap (right) depicting marker genes associated with pan-CAF subtypes. Pan-myCAF, myofibroblast-like CAFs; pan-dCAF, desmoplastic CAFs; pan-iCAF and pan-iCAF-2, inflammatory-like CAFs; pan-nCAF, normal myofibroblasts; pan-pCAF, proliferating CAFs. (B) Fraction of CAF subtypes in individual cancer types. (C) Dot plot showing expression of marker genes for pan-CAF subtypes. (D) Enriched gene sets for pan-CAF subtypes. (E) UMAP depicting cell cycle states of pan-CAF subtypes. (F) Heatmap of expression of genes associated with selected functions. (G) Heatmap of expression of genes encoding cell-surface proteins.
Figure 3.
Figure 3.. TFs and regulatory gene programs associated with pan-CAF subtypes.
(A) Heatmap of gene expression of transcription factors. (B) Violin plot depicting the MEF2C expression (top) and heatmap depicting MEF2C target genes upregulated in pan-myCAFs. (C) Violin plot depicting the TWIST1 expression (top) and heatmap depicting TWIST1 target genes upregulated in pan-dCAFs. (D) Violin plot depicting the NR1H3 expression (top) and heatmap depicting NR1H3 target genes upregulated in pan-iCAFs. (E) Violin plot depicting the RELB expression (top) and heatmap depicting RELB target genes upregulated in pan-iCAF-2. (F) Violin plot depicting the FOXM1 expression (top) and heatmap depicting FOXM1 target genes upregulated in pan-pCAF.
Figure 4.
Figure 4.. Specific pan-CAF subtypes linked to clinical outcome in distinct cancer types.
Kaplan-Meier plots depicting the survival differences among patients with high and low pan-myCAF in BLCA (A), pan-dCAF in KIRC (B) and STAD (C), pan-iCAF in LGG (D), and pan-iCAF-2 in SKCM (E), and pan-pCAF in MESO (F). (G) Clustering of tumor types by the hazard ratios (HRs) for the six pan-CAF gene signatures. Dot plot in which the size is related to statistical significance and the color indicates hazard ratio (red = hazard ratio above one [poor prognosis] and blue = hazard ratio below one [favorable prognosis]). * FDR < 0.05, ** FDR < 0.01.
Figure 5.
Figure 5.. Networks of REACTOME terms enriched or depleted in tumors with high expression of different pan-CAF signature genes.
Nodes are terms enriched (red circles) or depleted (blue circles) among genes expressed higher in tumors with increased expression of pan-CAF gene signatures, while edges link terms with overlapping genes. Connected nodes with similar functions are further summarized by a more generalized term using Enrichmentmap. In each node, the filled colors represented results from individual cancer types. (A) pan-myCAF results from BLCA and KIRP cancers. (B) pan-dCAF results for KIRC, KIRP, LGG, UVM, MESO, and STAD cancers. (C) pan-iCAF results for LGG. (D) pan-iCAF 2 results for LGG and SKCM cancers. (E) pan-pCAF for KIRC, KIRP, LGG, and MESO.
Figure 6.
Figure 6.. Pan-CAF subtypes in anti-PD1 resistant tumors.
(A) Gene set enrichment analysis for bladder tumors treated with anti-PD1 showing significant enrichment of pan-myCAF (left), pan-dCAF (left-middle), and pan-iCAF (right-middle), and pan-pCAF (right) gene signature in the progressive disease (PD) patients compared to complete response (CR) and partial response (PR) patients. (B) Gene set enrichment analysis for metastatic melanoma tumors treated with anti-PD1 treatment showing significant enrichment of pan-myCAF (left), pan-dCAF (left-middle), pan-iCAF (right-middle), pan-pCAF (right), and pan-iCAF-2 (left-bottom) gene signature in the PD patients compared to CR and PR patients. (C) Gene set enrichment analysis for kidney tumors treated with anti-PD1 treatment showing significant enrichment of pan-dCAF gene signature in the PD patients compared to CR and PR patients. The heatmaps in each panel shows the expression difference of the leading edge genes between PD and CR/PR tumors.

References

    1. Whiteside. The tumor microenvironment and its role in promoting tumor growth. Oncogene 2008; 27: 5904–5912. - PMC - PubMed
    1. Chen X and Song E. Turning foes to friends: targeting cancer-associated fibroblasts. Nat Rev Drug Discov 2019;18:99–115. - PubMed
    1. Liu T, Han C, Wang S, Fang P, Ma Z, Xu L, et al. Cancer-associated fibroblasts: an emerging target of anti-cancer immunotherapy. J Hematol Oncol 2019;12:86. - PMC - PubMed
    1. Zhang X, Jin X, Malladi S, Zou Y, Wen YH, Brogi E, et al. Selection of bone metastasis seeds by mesenchymal signals in the primary tumor stroma. Cell 2014;154:1060–1073. - PMC - PubMed
    1. Su S, Chen J, Yao H, Liu J, Yu S, Lao L, et al. CD10+ GPR77+ cancer-associated fibroblasts promote cancer formation and chemoresistance by sustaining cancer stemness. Cell 2018;172:841–856. - PubMed

Publication types

Substances