. 2021 Apr 7;41(14):3254-3265.
doi: 10.1523/JNEUROSCI.2275-20.2021. Epub 2021 Feb 23.

Dynamics of Heading and Choice-Related Signals in the Parieto-Insular Vestibular Cortex of Macaque Monkeys

Affiliations

Dynamics of Heading and Choice-Related Signals in the Parieto-Insular Vestibular Cortex of Macaque Monkeys

Aihua Chen et al. J Neurosci. .

Abstract

Perceptual decision-making is increasingly being understood to involve an interaction between bottom-up sensory-driven signals and top-down choice-driven signals, but how these signals interact to mediate perception is not well understood. The parieto-insular vestibular cortex (PIVC) is an area with prominent vestibular responsiveness, and previous work has shown that inactivating PIVC impairs vestibular heading judgments. To investigate the nature of PIVC's contribution to heading perception, we recorded extracellularly from PIVC neurons in two male rhesus macaques during a heading discrimination task, and compared findings with data from previous studies of dorsal medial superior temporal (MSTd) and ventral intraparietal (VIP) areas using identical stimuli. By computing partial correlations between neural responses, heading, and choice, we find that PIVC activity reflects a dynamically changing combination of sensory and choice signals. In addition, the sensory and choice signals are more balanced in PIVC, in contrast to the sensory dominance in MSTd and choice dominance in VIP. Interestingly, heading and choice signals in PIVC are negatively correlated during the middle portion of the stimulus epoch, reflecting a mismatch in the polarity of heading and choice signals. We anticipate that these results will help unravel the mechanisms of interaction between bottom-up sensory signals and top-down choice signals in perceptual decision-making, leading to more comprehensive models of self-motion perception.SIGNIFICANCE STATEMENT Vestibular information is important for our perception of self-motion, and various cortical regions in primates show vestibular heading selectivity. Inactivation of the macaque vestibular cortex substantially impairs the precision of vestibular heading discrimination, more so than inactivation of other multisensory areas. Here, we record for the first time from the vestibular cortex while monkeys perform a forced-choice heading discrimination task, and we compare results with data collected previously from other multisensory cortical areas. We find that vestibular cortex activity reflects a dynamically changing combination of sensory and choice signals, with both similarities and notable differences with other multisensory areas.

Keywords: PIVC; bottom-up; choice; partial correlation; sensory; top-down.


Figures

Figure 1.
Figure 1.
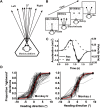
Experimental setup and heading discrimination task. A, Using a motion platform, animals were translated forward along different headings in the horizontal plane, where 0° heading denotes translation straight ahead. B, Each trial started with the appearance of a small fixation target in the center of the screen. Monkeys fixate the target while being passively moved. As soon as motion is completed, the fixation point disappears and two choice targets appear. Monkeys are required to make a saccade to one of the two targets to report their perceived heading (left or right relative to straight ahead). C, The inertial motion stimulus followed a Gaussian velocity profile (black dashed line) over the stimulus duration of 2 s. The corresponding acceleration profile was biphasic (black solid line) with a peak acceleration of 0.1 G. The solid curve represents the output of a linear accelerometer attached to the motion platform, whereas the dashed curve corresponds to its integral. D, Psychophysical performance in the heading discrimination task. Thin gray curves show individual psychometric functions for all PIVC recording sessions from Monkey U (N = 75) and Monkey J (N = 29), showing proportion of rightward decisions as a function of heading. Monkey C was not included here since only four recording sessions were performed in this monkey. Black squares represent the average (±SD) values across all sessions. Red curves represent cumulative Gaussian fits to the average data.
Figure 2.
Figure 2.
Example responses from SP and DP cells during measurements of 3D heading tuning. A, B, Response PSTHs for example neurons having SP (A) and DP (B) dynamics. Each PSTH shows the mean response to one stimulus direction defined in spherical coordinates by its azimuth (varying along the abscissa) and elevation (varying along the ordinate) angles. Vertical dashed black lines (t = 0.85 s) in panel A indicate the time at which the maximum response across directions occurred (peak time). Vertical dashed red (t = 0.95 s) and green (t = 1.45 s) lines in panel B illustrate the two peak times for the DP cell. PSTHs were computed with sequential 25-ms bins and then smoothed with a 400-ms sliding window. C, Color contour map showing the 3D heading tuning profile (Lambert cylindrical projection) at peak time for the SP cell of panel A. This SP cell was significantly tuned for heading (ANOVA, p = 3.3 × 10⁻⁹), with a preferred direction (computed as the vector sum of response) at azimuth = 11° and elevation = 3°, corresponding to a rightward and slightly downward movement. D, E, Color contour maps showing 3D heading tuning profiles at the two peak times for the DP cell of panel B. The direction tuning at the first peak time had a heading preference at [azimuth, elevation] = [−60°, 36°] (D), whereas the later peak of tuning was centered at [azimuth, elevation] = [112°, −40°] (E). The difference between the two direction preferences for this neuron was 172°.
Figure 3.
Figure 3.
Vestibular tuning for heading in the horizontal plane. A, Average PSTHs for eight headings in the horizontal plane for an example SP neuron. Vertical dashed black lines indicate the peak time (t = 0.93 s). B, Average response PSTHs for an example DP neuron. Red and green dashed vertical lines indicate the early and late peak times (t = 0.68 and 1.18 s). C, Heading tuning curve for the SP neuron. The mean firing rate (±SE) calculated at the peak time is plotted as a function of heading. The heading preference is 33°, which corresponds to forward/rightward motion. Striped area illustrates the narrow range of headings tested during the discrimination task. D, Heading tuning curves for the DP neuron, computed at first peak time (red) and second peak time (green). E, Distribution of peak times for SP cells (black), as well as the first (red) and second (green) peak times of DP cells. Arrowheads illustrate mean values.
Figure 4.
Figure 4.
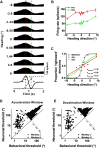
Quantification of neuronal sensitivity in area PIVC. A, Average PSTHs for each of nine headings tested in the discrimination task. Each PSTH was constructed using 25-ms time bins and was smoothed with a 400-ms boxcar filter. Vertical dashed red and green lines indicate the times of peak stimulus acceleration and deceleration (t = 0.82 and 1.18 s). Stimulus velocity (dashed line), acceleration (black solid line), and position (dotted line) profiles are overlaid for comparison (bottom row). B, Firing rates (mean ± SE) of the same cell for the two time windows (red, acceleration window; green, deceleration window), plotted as a function of heading (positive values indicate rightward headings). C, Psychometric function (black x) and neurometric functions corresponding to the acceleration (red, 0.82 s) and deceleration (green, 1.18 s) time windows. Smooth curves show cumulative Gaussian fits. Threshold values that summarize behavioral (σbehavior) and neuronal (σneu_Acc, σneu_Dec) performance are given. D, E, Summary of the relationship between neuronal and psychophysical thresholds for the acceleration (D) and deceleration (E) time windows. Diagonal marginal histograms indicate the distributions of the ratio of neuronal:psychophysical thresholds.
Figure 5.
Figure 5.
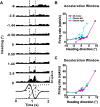
Computation of choice-conditioned tuning curves for an example PIVC neuron. A, Average PSTHs for the nine headings tested in the discrimination task, with 400-ms analysis window slid across the data in steps of 25 ms. Red and green lines indicate the times of peak stimulus acceleration and deceleration (t = 0.82 and 1.18 s). Format as in Figure 4A. B, Responses of the same cell for the acceleration window, plotted as a function of heading. The black curve indicates the heading tuning based on all trials. Cyan and magenta curves show choice-conditioned heading tuning curves corresponding to leftward and rightward choices, respectively. C, Heading tuning curves for the deceleration time window. Format as in Figure 4B.
Figure 6.
Figure 6.
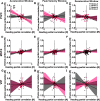
Relationships between choice and heading partial correlations for areas PIVC (AC), MSTd (DF), and VIP (GI) during acceleration (A, D, G), peak velocity (B, E, H), and deceleration (C, F, I) time windows. Partial correlations were calculated between neuronal firing rates and stimulus headings (given the actual choices made by the monkey) or choices (given the stimulus heading). Each data point represents choice and heading partial correlation coefficients calculated using a 100-ms analysis window centered at peak acceleration (t = 0.82 s), velocity (t = 1.0 s), and deceleration (t = 1.18 s) of the motion profile for one cell. Data are shown separately for SP cells (black symbols) and DP cells (pink symbols). Solid lines and the shaded regions represent Type-II regressions with their 95% confidence intervals.
Figure 7.
Figure 7.
Time course heading and choice signals in PIVC. A, B, Temporal profiles of squared partial correlation coefficients (R2) for heading (A) and choice (B), plotted separated for SP (solid black) and DP (solid pink) cells. Error bands represent 95% confidence intervals. The dashed lines show the corresponding ARIMA fits.
Figure 8.
Figure 8.
Comparison of time course of heading and choice signals between areas PIVC, MSTd, and VIP. A, Time course of the average squared heading partial correlation for PIVC (red), MSTd (black), and VIP (dark yellow). Error bands represent 95% confidence intervals. B, Time courses of the average squared choice partial correlations. Format as in panel A. C, The ratio of the mean for squared heading versus choice partial correlations across time in PIVC, MSTd, and VIP. The shaded areas correspond to 95% confidence intervals obtained using the bootstrap analysis. Dashed lines in each panel show ARIMA fits to the data.

Similar articles

Cited by

References

    1. Abdelhack M, Kamitani Y (2018) Sharpening of hierarchical visual feature representations of blurred images. eNeuro 5:ENEURO.0443-17.2018. 10.1523/ENEURO.0443-17.2018 - DOI - PMC - PubMed
    1. Abrahamyan A, Silva LL, Dakin SC, Carandini M, Gardner JL (2016) Adaptable history biases in human perceptual decisions. Proc Natl Acad Sci USA 113:E3548–E3557. 10.1073/pnas.1518786113 - DOI - PMC - PubMed
    1. Alink A, Schwiedrzik CM, Kohler A, Singer W, Muckli L (2010) Stimulus predictability reduces responses in primary visual cortex. J Neurosci 30:2960–2966. 10.1523/JNEUROSCI.3730-10.2010 - DOI - PMC - PubMed
    1. Aydın Ç, Couto J, Giugliano M, Farrow K, Bonin V (2018) Locomotion modulates specific functional cell types in the mouse visual thalamus. Nat Commun 9:4882. 10.1038/s41467-018-06780-3 - DOI - PMC - PubMed
    1. Benucci A, Saleem AB, Carandini M (2013) Adaptation maintains population homeostasis in primary visual cortex. Nat Neurosci 16:724–729. 10.1038/nn.3382 - DOI - PMC - PubMed

Publication types

MeSH terms

LinkOut - more resources