

Virological Characteristics of Hospitalized Children With SARS-CoV-2 Infection
- PMID: 33622794
- PMCID: PMC8086003
- DOI: 10.1542/peds.2020-037812
Virological Characteristics of Hospitalized Children With SARS-CoV-2 Infection
Abstract
Background and objectives: In children with severe acute respiratory syndrome coronavirus 2 (SARS-CoV-2) infection, virological characteristics and correlation with disease severity have not been extensively studied. The primary objective in this study is to determine the correlation between SARS-CoV-2 viral load (VL) in infected children with age, disease severity, and underlying comorbidities.
Methods: Children <21 years, screened for SARS-CoV-2 at the time of hospitalization, who tested positive by polymerase chain reaction were included in this study. VL at different sites was determined and compared between groups.
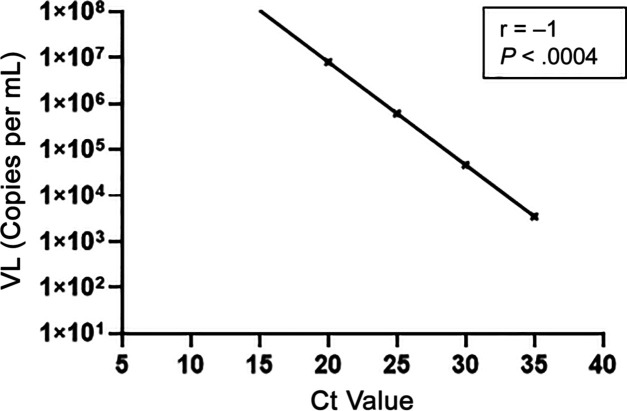
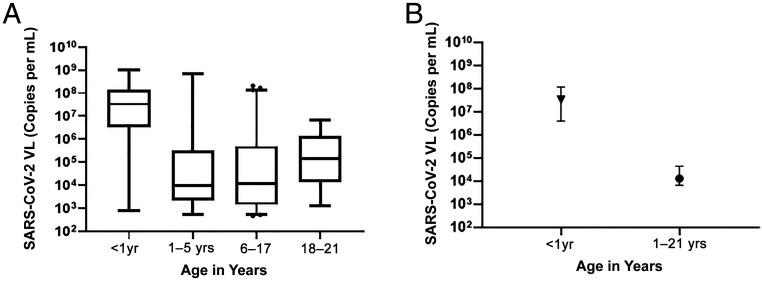
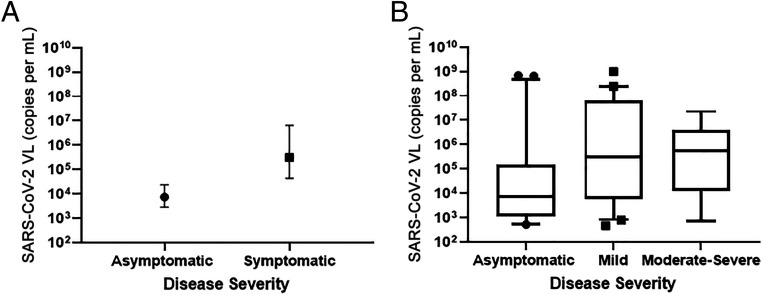
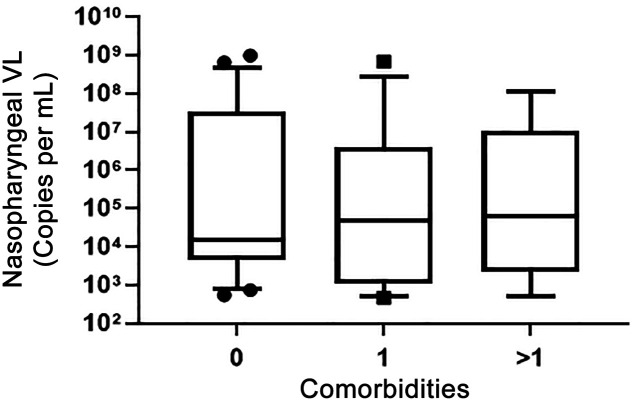
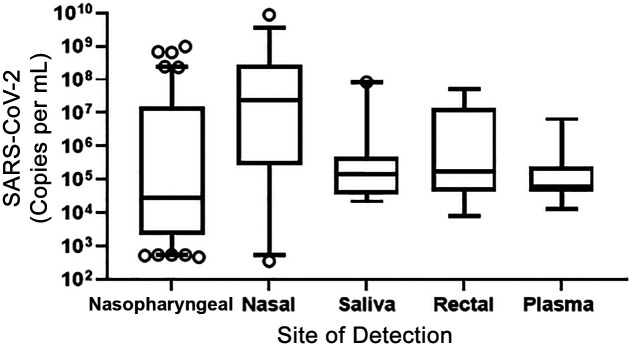
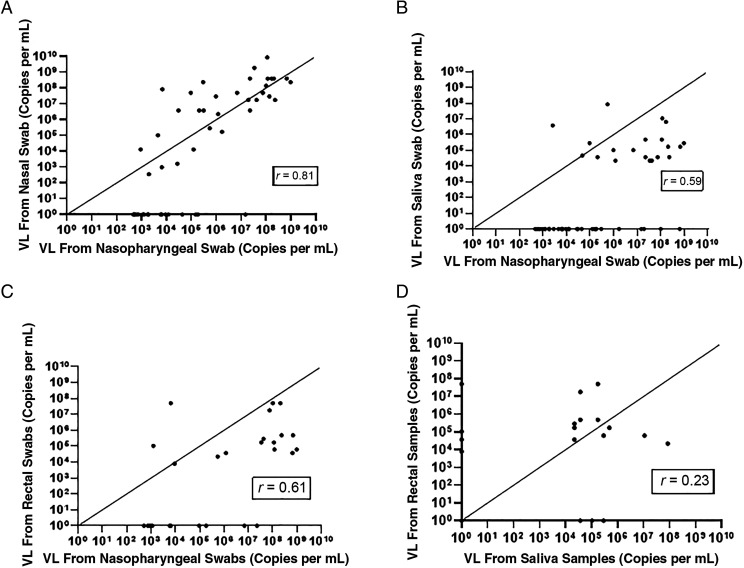
Results: Of the 102 children included in this study, 44% of the cohort had asymptomatic infection, and children with >1 comorbidity were the most at risk for severe disease. VL in children with symptomatic infection was significantly higher than in children with asymptomatic infection (3.0 × 10⁵ vs 7.2 × 10³ copies per mL; P = .001). VL in the respiratory tract was significantly higher in children <1 year, compared with older children (3.3 × 10⁷ vs 1.3 × 10⁴ copies per mL respectively; P < .0001), despite most infants presenting with milder illness. Besides the respiratory tract, SARS-CoV-2 RNA was also detectable in samples from the gastrointestinal tract (saliva and rectum) and blood. In 13 children for whom data on duration of polymerase chain reaction positivity was available, 12 of 13 tested positive 2 weeks after initial diagnosis, and 6 of 13 continued to test positive 4 weeks after initial diagnosis.
Conclusions: In hospitalized children with SARS-CoV-2, those with >1 comorbid condition experienced severe disease. SARS-CoV-2 VL in the respiratory tract is significantly higher in children with symptomatic disease and children <1 year of age.
Copyright © 2021 by the American Academy of Pediatrics.
Conflict of interest statement
POTENTIAL CONFLICT OF INTEREST: The authors have indicated they have no potential conflicts of interest to disclose.
Figures
Similar articles
-
Comparison of Upper Respiratory Viral Load Distributions in Asymptomatic and Symptomatic Children Diagnosed with SARS-CoV-2 Infection in Pediatric Hospital Testing Programs.J Clin Microbiol. 2020 Dec 17;59(1):e02593-20. doi: 10.1128/JCM.02593-20. Print 2020 Dec 17. J Clin Microbiol. 2020. PMID: 33093026 Free PMC article.
-
Serial Screening for SARS-CoV-2 in Rectal Swabs of Symptomatic COVID-19 Patients.J Korean Med Sci. 2021 Nov 15;36(44):e301. doi: 10.3346/jkms.2021.36.e301. J Korean Med Sci. 2021. PMID: 34783217 Free PMC article.
-
Upper respiratory tract SARS-CoV-2 RNA loads in symptomatic and asymptomatic children and adults.Clin Microbiol Infect. 2021 Dec;27(12):1858.e1-1858.e7. doi: 10.1016/j.cmi.2021.08.001. Epub 2021 Aug 9. Clin Microbiol Infect. 2021. PMID: 34384874 Free PMC article.
-
SARS-CoV-2 shedding dynamics across the respiratory tract, sex, and disease severity for adult and pediatric COVID-19.Elife. 2021 Aug 20;10:e70458. doi: 10.7554/eLife.70458. Elife. 2021. PMID: 34414888 Free PMC article.
-
Duration of Respiratory and Gastrointestinal Viral Shedding in Children With SARS-CoV-2: A Systematic Review and Synthesis of Data.Pediatr Infect Dis J. 2020 Sep;39(9):e249-e256. doi: 10.1097/INF.0000000000002814. Pediatr Infect Dis J. 2020. PMID: 32618932
Cited by
-
COVID-19 in Children: Correlation Between Epidemiologic, Clinical Characteristics, and RT-qPCR Cycle Threshold Values.Pediatr Infect Dis J. 2022 Aug 1;41(8):666-670. doi: 10.1097/INF.0000000000003564. Epub 2022 Jul 13. Pediatr Infect Dis J. 2022. PMID: 35544738 Free PMC article.
-
Correlation of SARS-CoV-2 Viral Load and Clinical Evolution of Pediatric Patients in a General Hospital From Buenos Aires, Argentina.Front Pediatr. 2022 Jul 7;10:883395. doi: 10.3389/fped.2022.883395. eCollection 2022. Front Pediatr. 2022. PMID: 35874580 Free PMC article.
-
Long-term outcome of vestibular function and hearing in children with congenital cytomegalovirus infection: a prospective cohort study.Eur Arch Otorhinolaryngol. 2023 Jul;280(7):3141-3147. doi: 10.1007/s00405-022-07816-7. Epub 2023 Jan 16. Eur Arch Otorhinolaryngol. 2023. PMID: 36645498 Free PMC article.
-
Clinical features and characteristics of pediatric patients with COVID-19 infection: Experiences in a Tertiary Taiwan Hospital.Medicine (Baltimore). 2022 Sep 2;101(35):e30157. doi: 10.1097/MD.0000000000030157. Medicine (Baltimore). 2022. PMID: 36107524 Free PMC article.
-
Pediatric Radiology in Era of COVID-19, International Consensus and What Lies Beyond Pneumonia: A Review.JNMA J Nepal Med Assoc. 2021 Nov 15;59(243):1196-1203. doi: 10.31729/jnma.7122. JNMA J Nepal Med Assoc. 2021. PMID: 35199747 Free PMC article. Review.
References
-
- Wu Z, McGoogan JM. Characteristics of and important lessons from the Coronavirus Disease 2019 (COVID-19) outbreak in China: summary of a report of 72 314 cases from the Chinese Center for Disease Control and Prevention. JAMA. 2020;323(13):1239–1242 - PubMed
-
- Liu PP, Blet A, Smyth D, Li H. The science underlying COVID-19: implications for the cardiovascular system. Circulation. 2020;142(1):68–78 - PubMed
-
- Madjid M, Safavi-Naeini P, Solomon SD, Vardeny O. Potential effects of coronaviruses on the cardiovascular system: a Review. JAMA Cardiol. 2020;5(7):831–840 - PubMed
Publication types
MeSH terms
Grants and funding
LinkOut - more resources
Full Text Sources
Other Literature Sources
Medical
Miscellaneous
