

Data Analysis Strategies for Microbiome Studies in Human Populations-a Systematic Review of Current Practice
- PMID: 33622856
- PMCID: PMC8573962
- DOI: 10.1128/mSystems.01154-20
Data Analysis Strategies for Microbiome Studies in Human Populations-a Systematic Review of Current Practice
Abstract
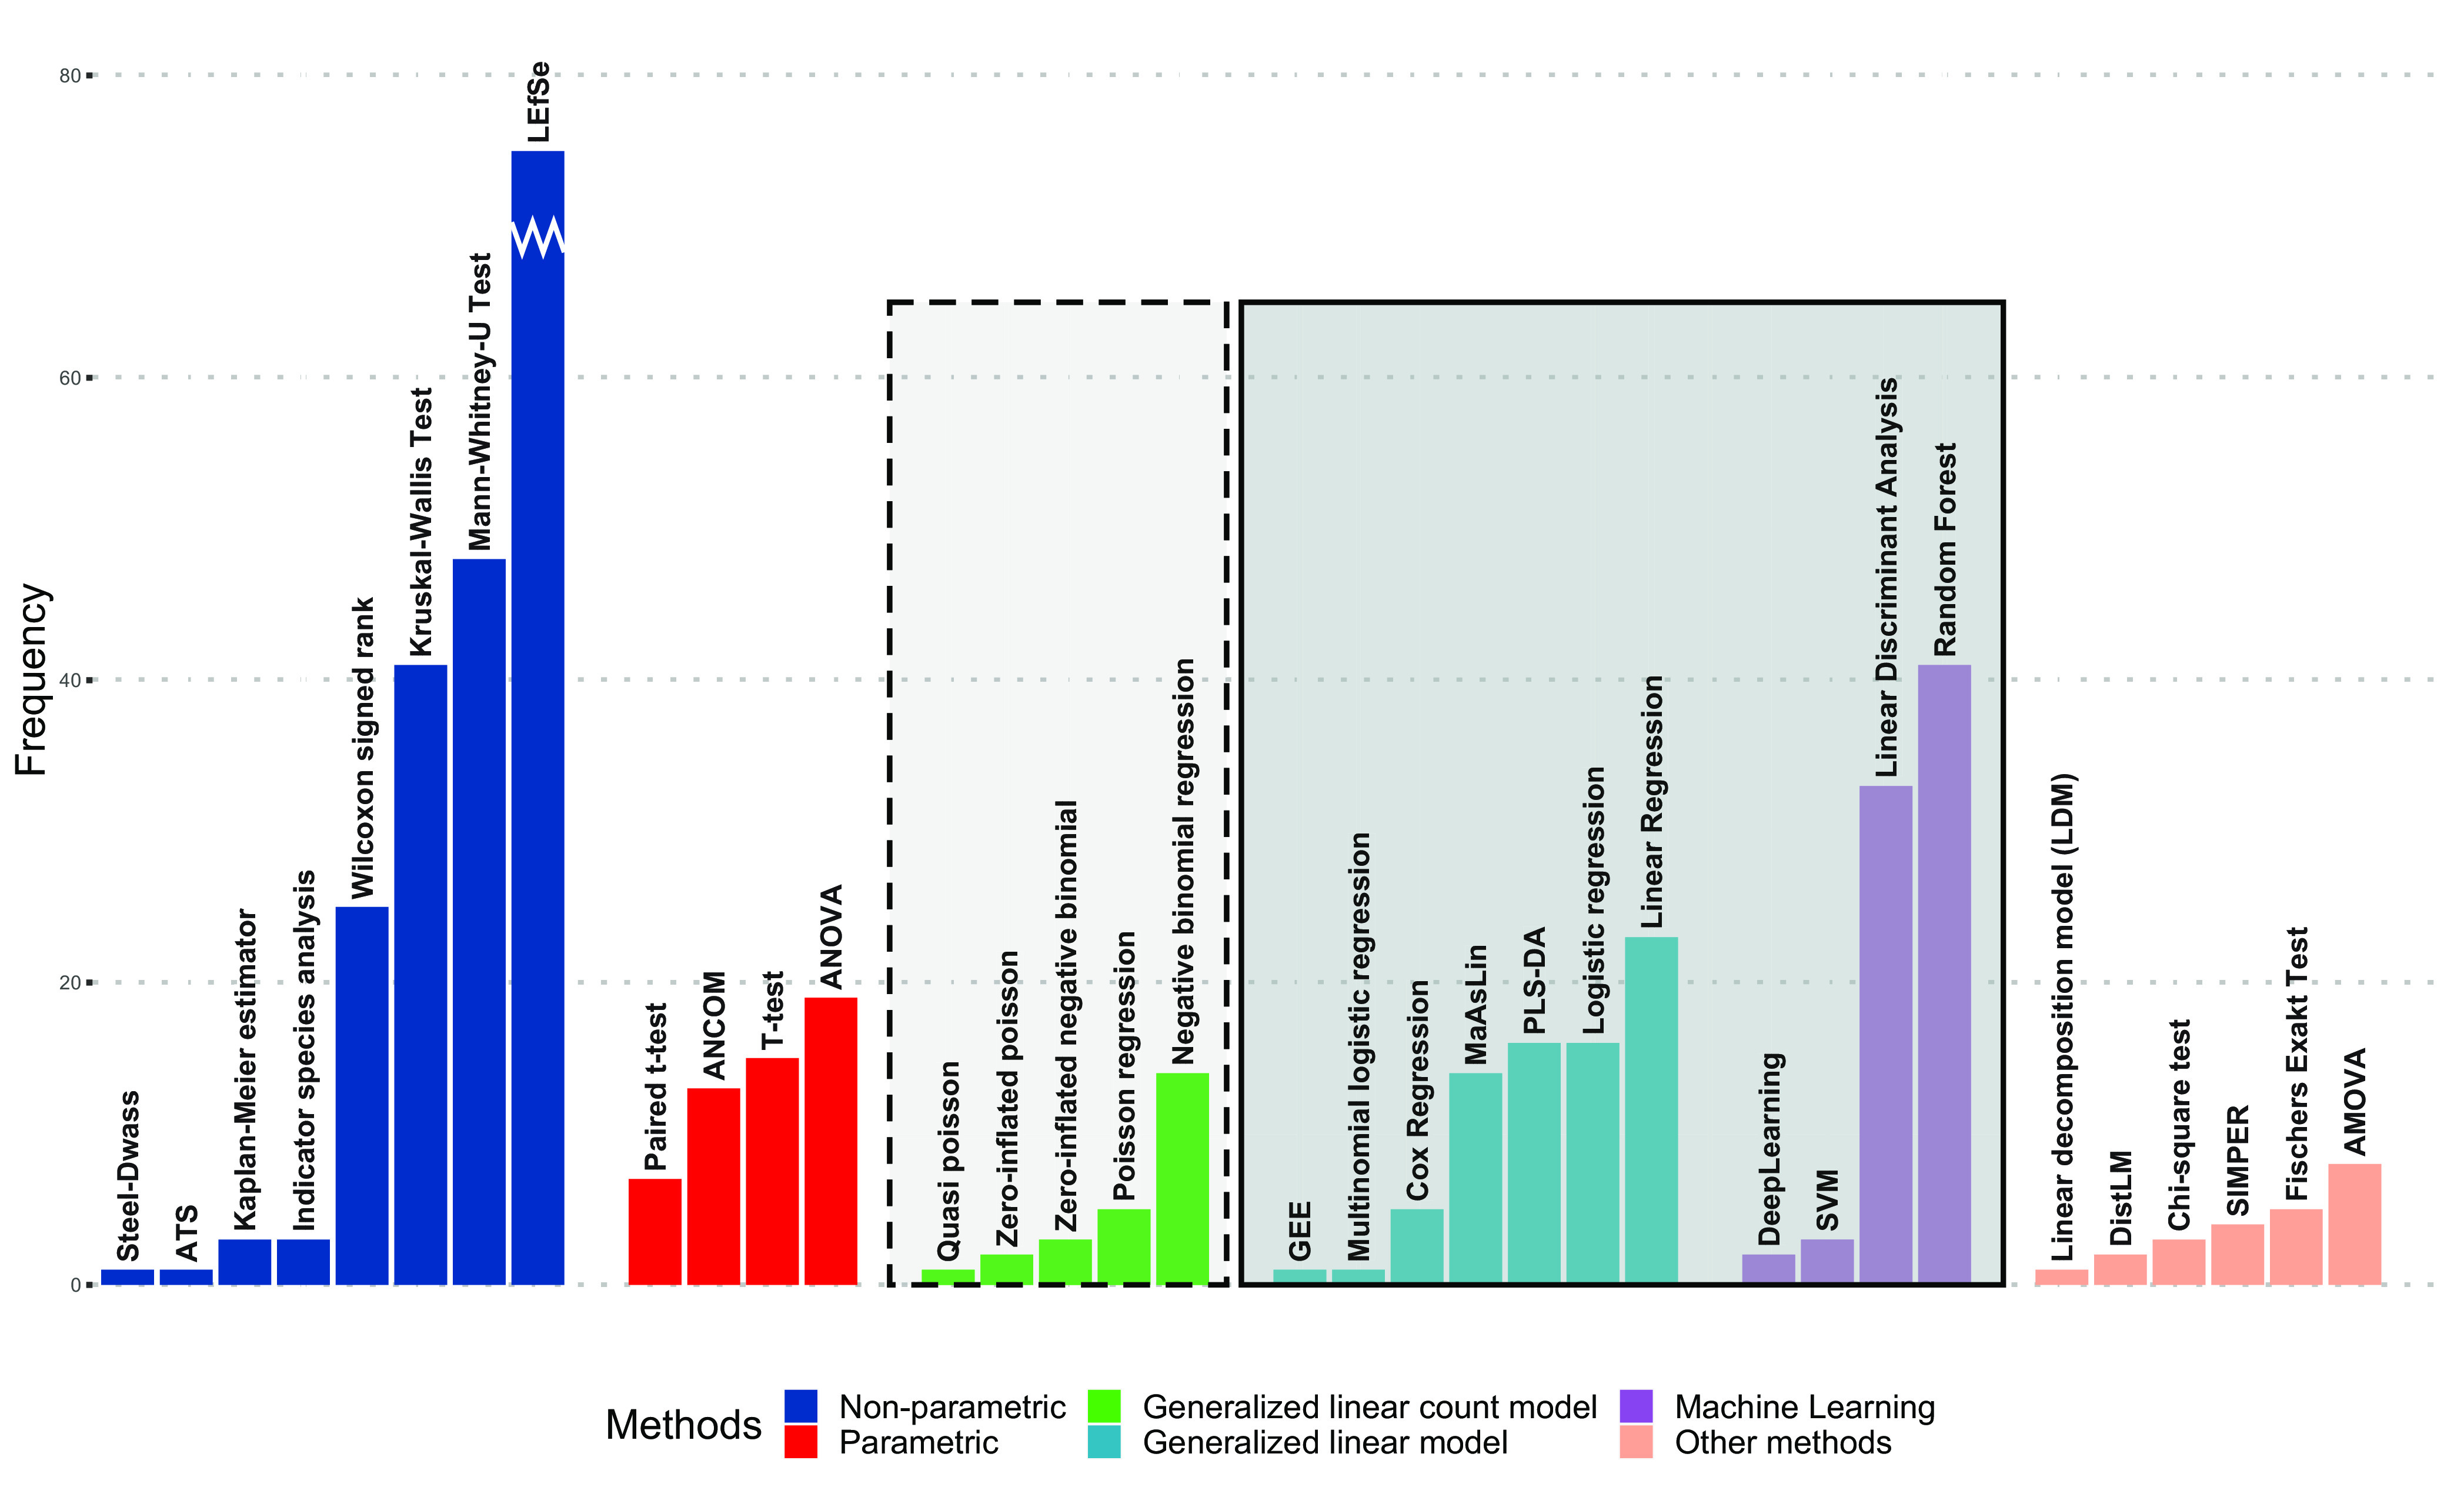
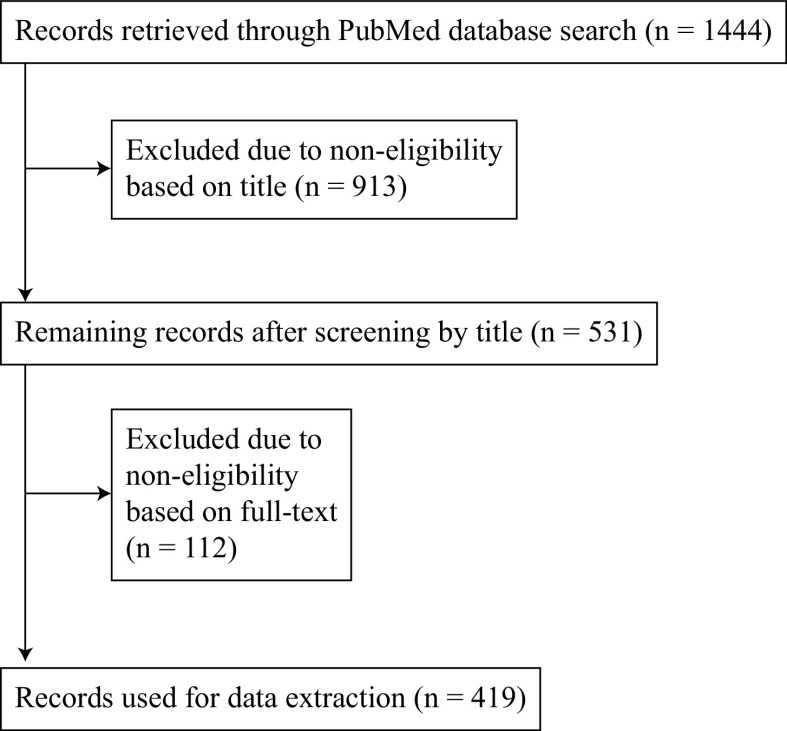
Reproducibility is a major issue in microbiome studies, which is partly caused by missing consensus about data analysis strategies. The complex nature of microbiome data, which are high-dimensional, zero-inflated, and compositional, makes them challenging to analyze, as they often violate assumptions of classic statistical methods. With advances in human microbiome research, research questions and study designs increase in complexity so that more sophisticated data analysis concepts are applied. To improve current practice of the analysis of microbiome studies, it is important to understand what kind of research questions are asked and which tools are used to answer these questions. We conducted a systematic literature review considering all publications focusing on the analysis of human microbiome data from June 2018 to June 2019. Of 1,444 studies screened, 419 fulfilled the inclusion criteria. Information about research questions, study designs, and analysis strategies were extracted. The results confirmed the expected shift to more advanced research questions, as one-third of the studies analyzed clustered data. Although heterogeneity in the methods used was found at any stage of the analysis process, it was largest for differential abundance testing. Especially if the underlying data structure was clustered, we identified a lack of use of methods that appropriately addressed the underlying data structure while taking into account additional dependencies in the data. Our results confirm considerable heterogeneity in analysis strategies among microbiome studies; increasingly complex research questions require better guidance for analysis strategies.IMPORTANCE The human microbiome has emerged as an important factor in the development of health and disease. Growing interest in this topic has led to an increasing number of studies investigating the human microbiome using high-throughput sequencing methods. However, the development of suitable analytical methods for analyzing microbiome data has not kept pace with the rapid progression in the field. It is crucial to understand current practice to identify the scope for development. Our results highlight the need for an extensive evaluation of the strengths and shortcomings of existing methods in order to guide the choice of proper analysis strategies. We have identified where new methods could be designed to address more advanced research questions while taking into account the complex structure of the data.
Keywords: 16S rRNA; analysis strategies; microbiome; shotgun metagenomics sequencing.
Copyright © 2021 Kleine Bardenhorst et al.
Figures

References
-
- Sczyrba A, Hofmann P, Belmann P, Koslicki D, Janssen S, Dröge J, Gregor I, Majda S, Fiedler J, Dahms E, Bremges A, Fritz A, Garrido-Oter R, Jørgensen TS, Shapiro N, Blood PD, Gurevich A, Bai Y, Turaev D, DeMaere MZ, Chikhi R, Nagarajan N, Quince C, Meyer F, Balvočiūtė M, Hansen LH, Sørensen SJ, Chia BKH, Denis B, Froula JL, Wang Z, Egan R, Kang DD, Cook JJ, Deltel C, Beckstette M, Lemaitre C, Peterlongo P, Rizk G, Lavenier D, Wu YW, Singer SW, Jain C, Strous M, Klingenberg H, Meinicke P, Barton MD, Lingner T, Lin HH, Liao YC, Silva GGZ, et al.. 2017. Critical assessment of metagenome interpretation—a benchmark of metagenomics software. Nat Methods 14:1063–1071. doi:10.1038/nmeth.4458. - DOI - PMC - PubMed
LinkOut - more resources
Full Text Sources
Other Literature Sources
