

Clonal expansion and activation of tissue-resident memory-like Th17 cells expressing GM-CSF in the lungs of severe COVID-19 patients
- PMID: 33622974
- PMCID: PMC8128299
- DOI: 10.1126/sciimmunol.abf6692
Clonal expansion and activation of tissue-resident memory-like Th17 cells expressing GM-CSF in the lungs of severe COVID-19 patients
Abstract
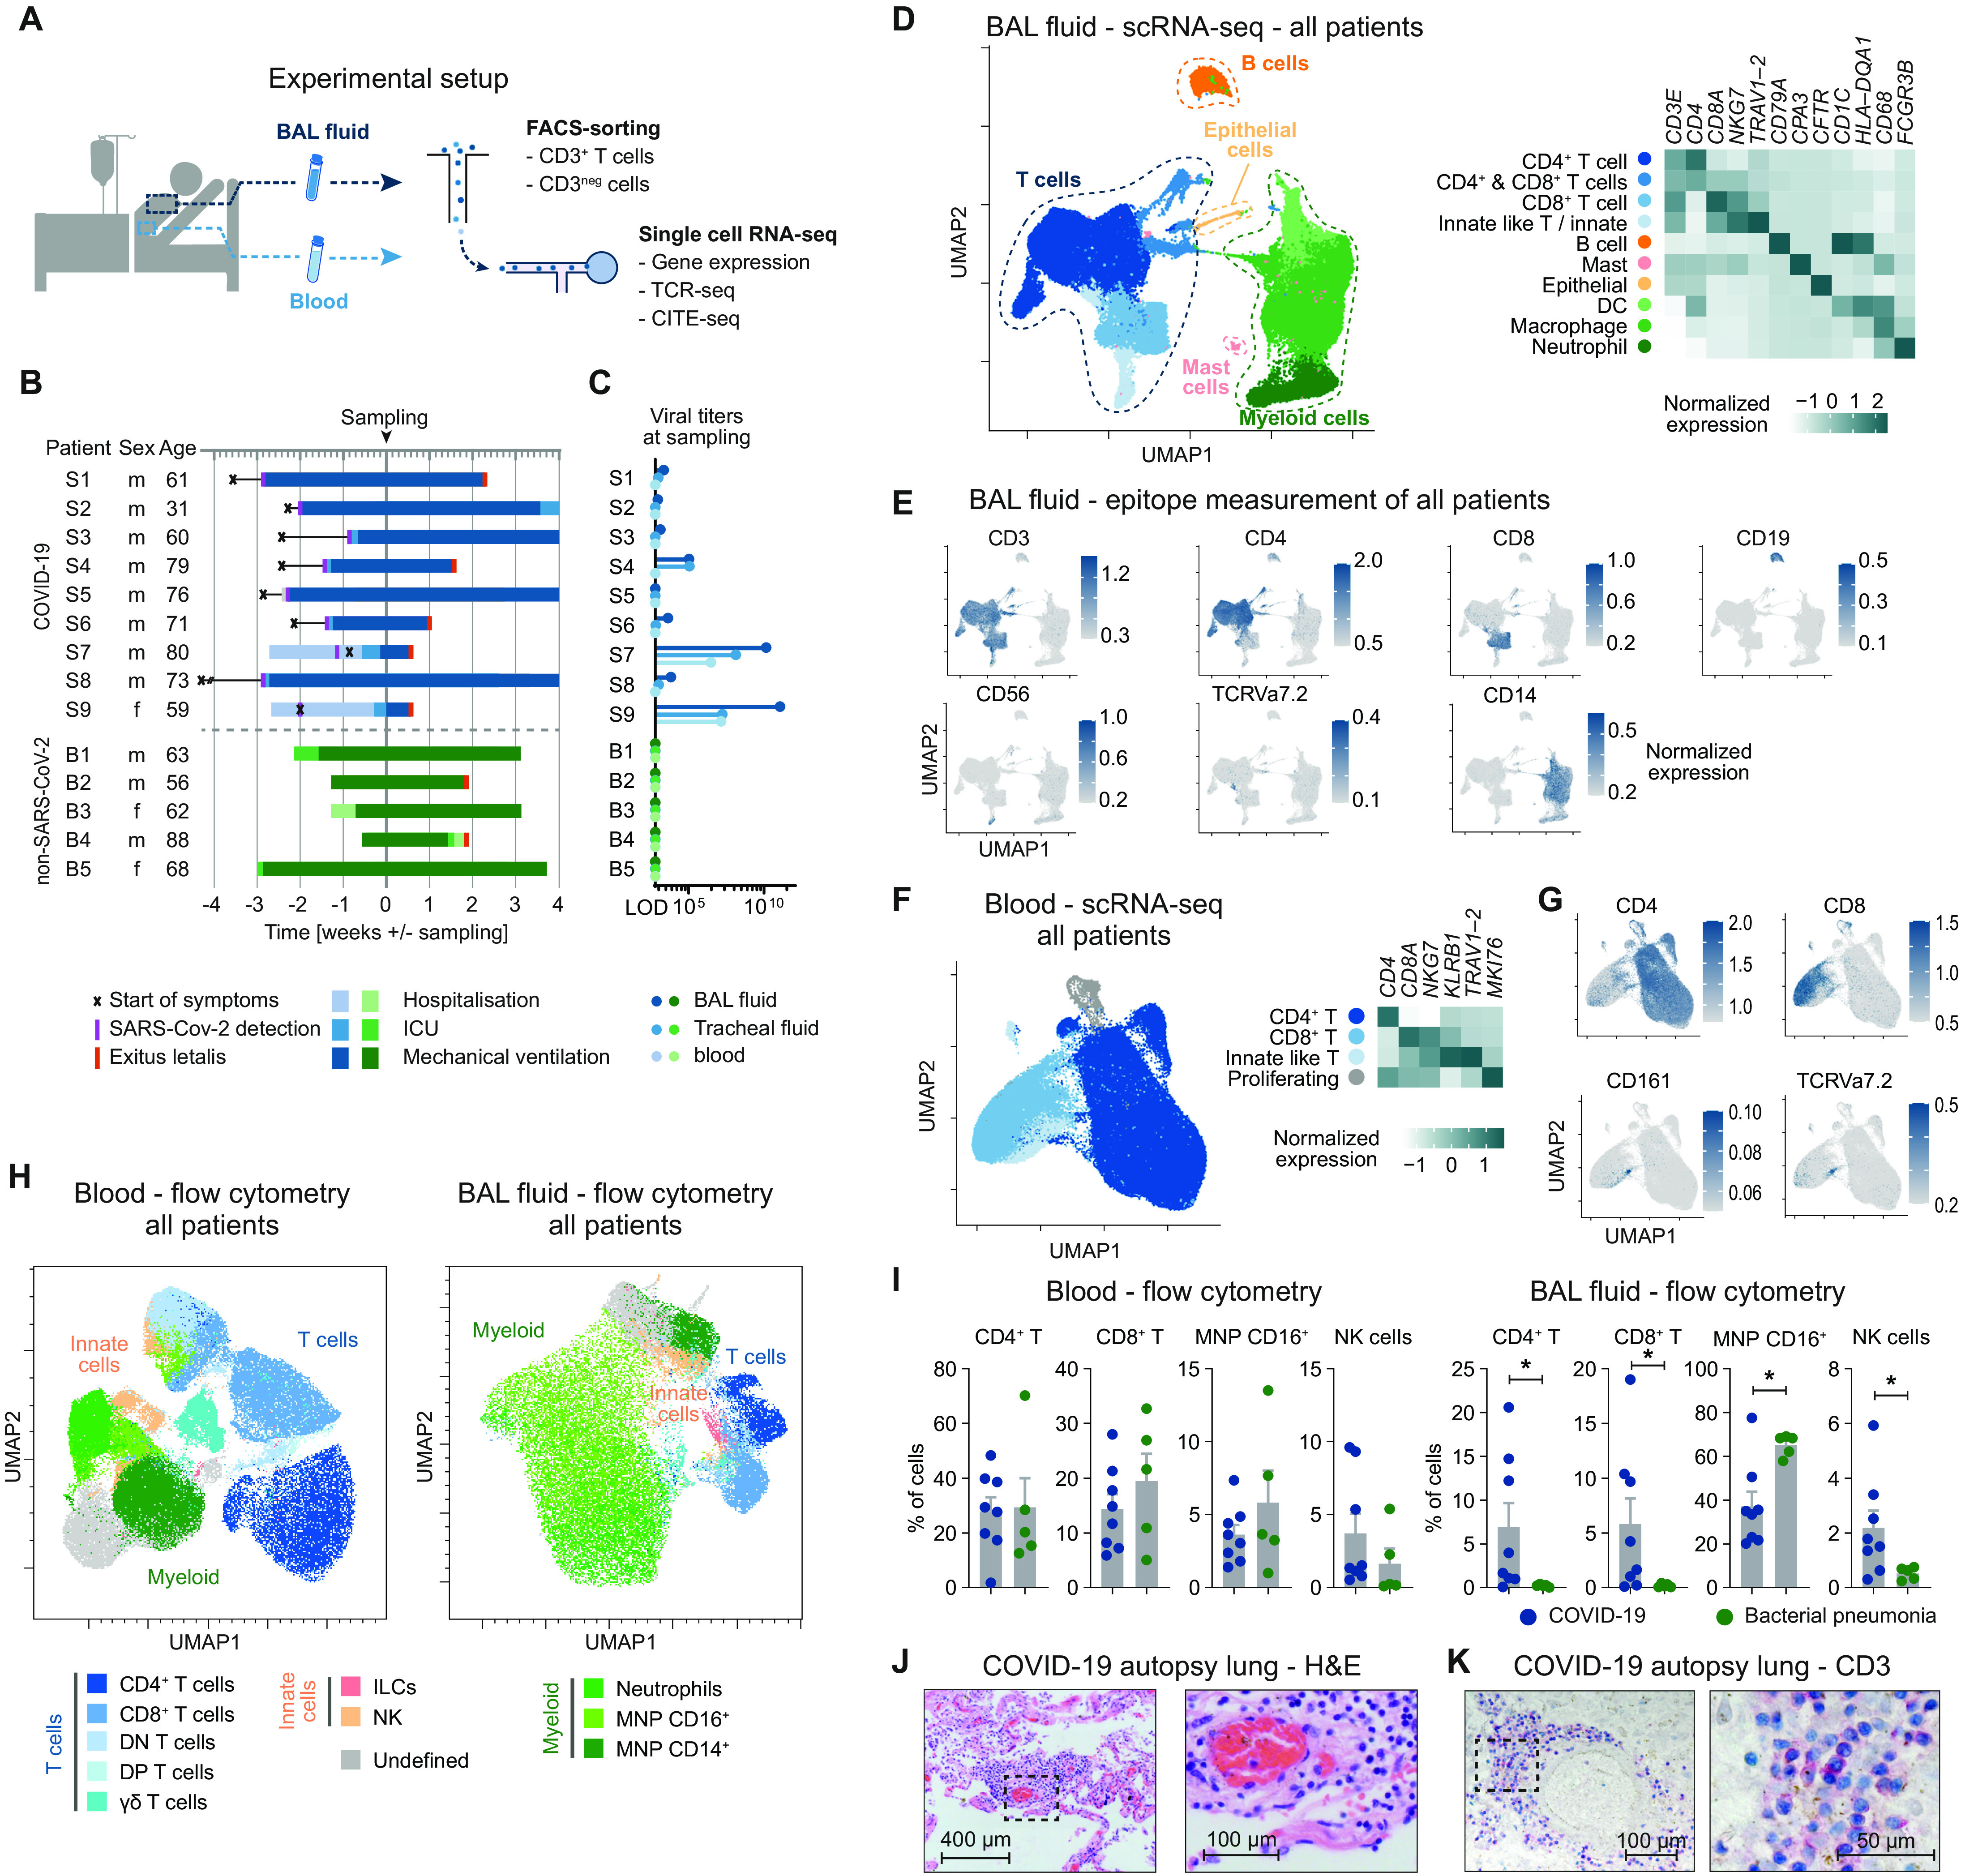
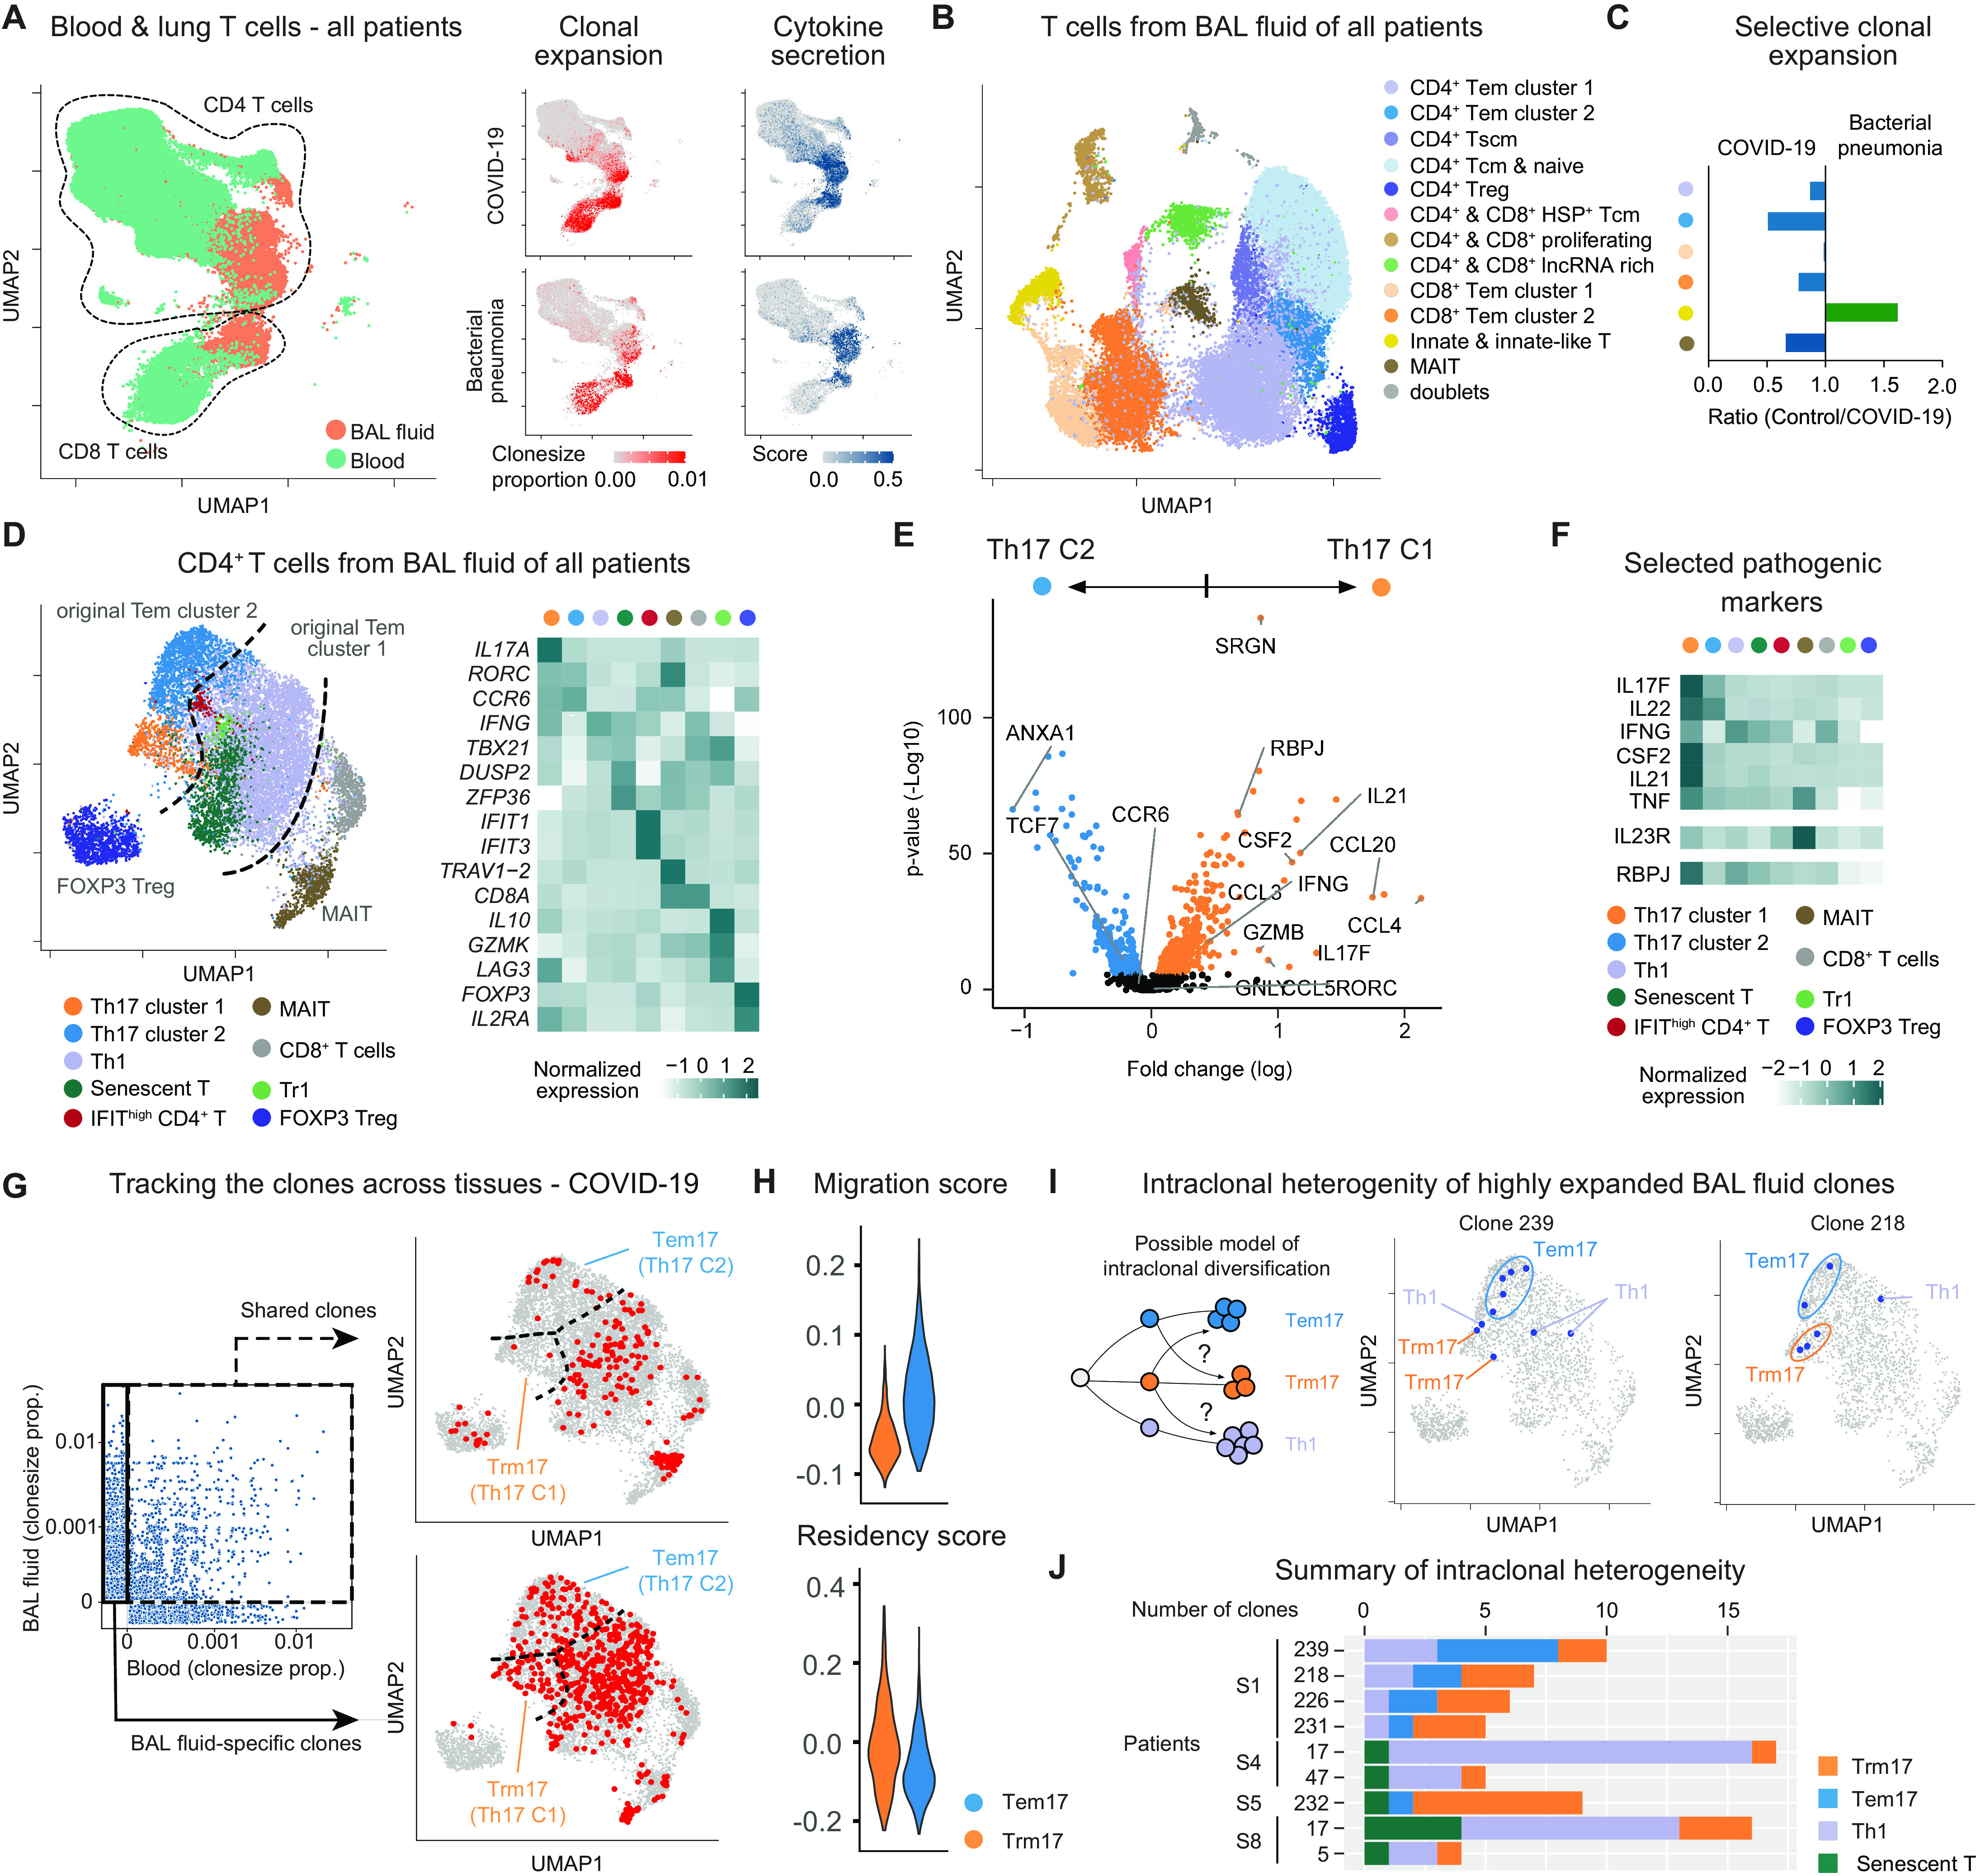
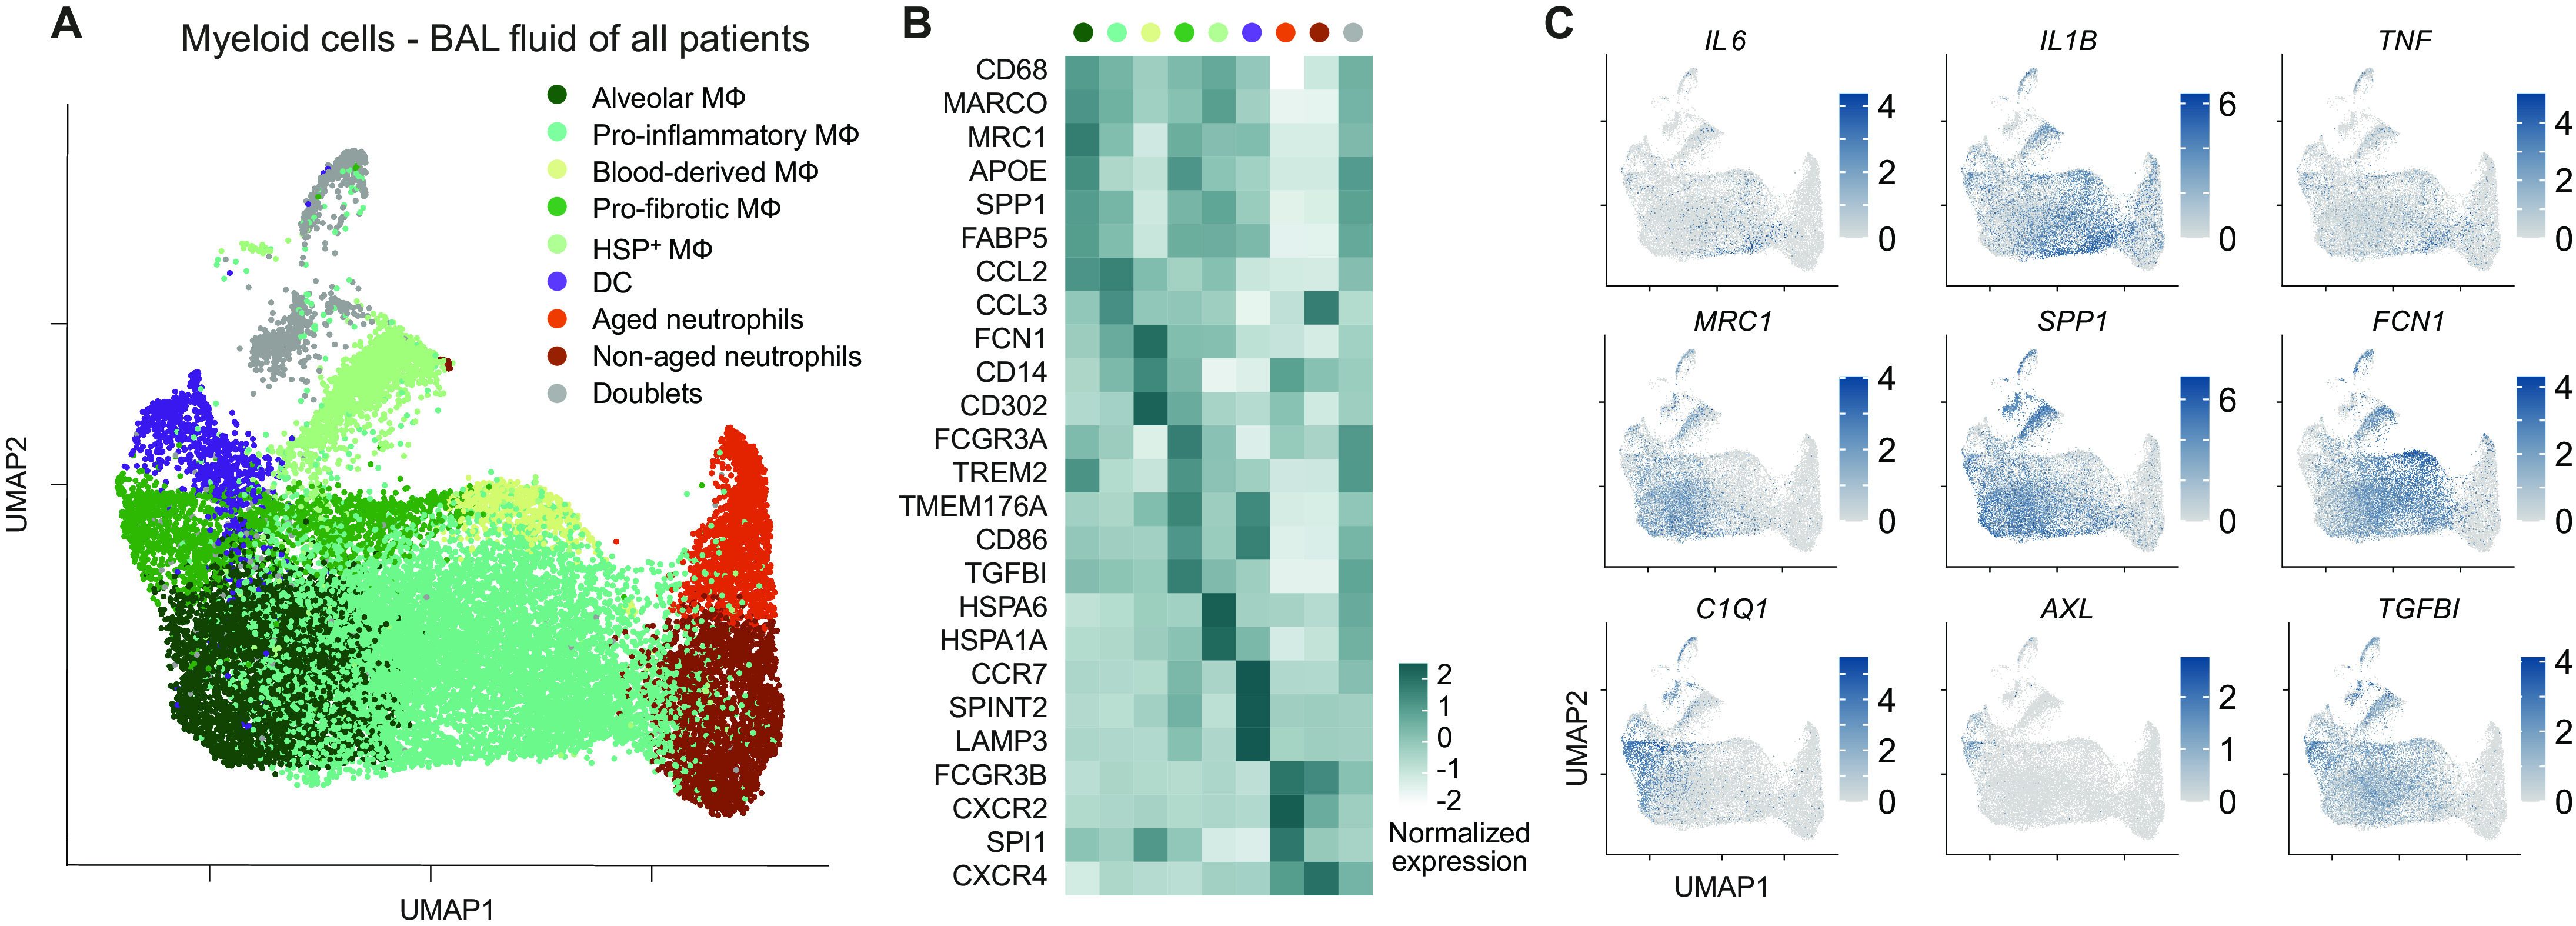
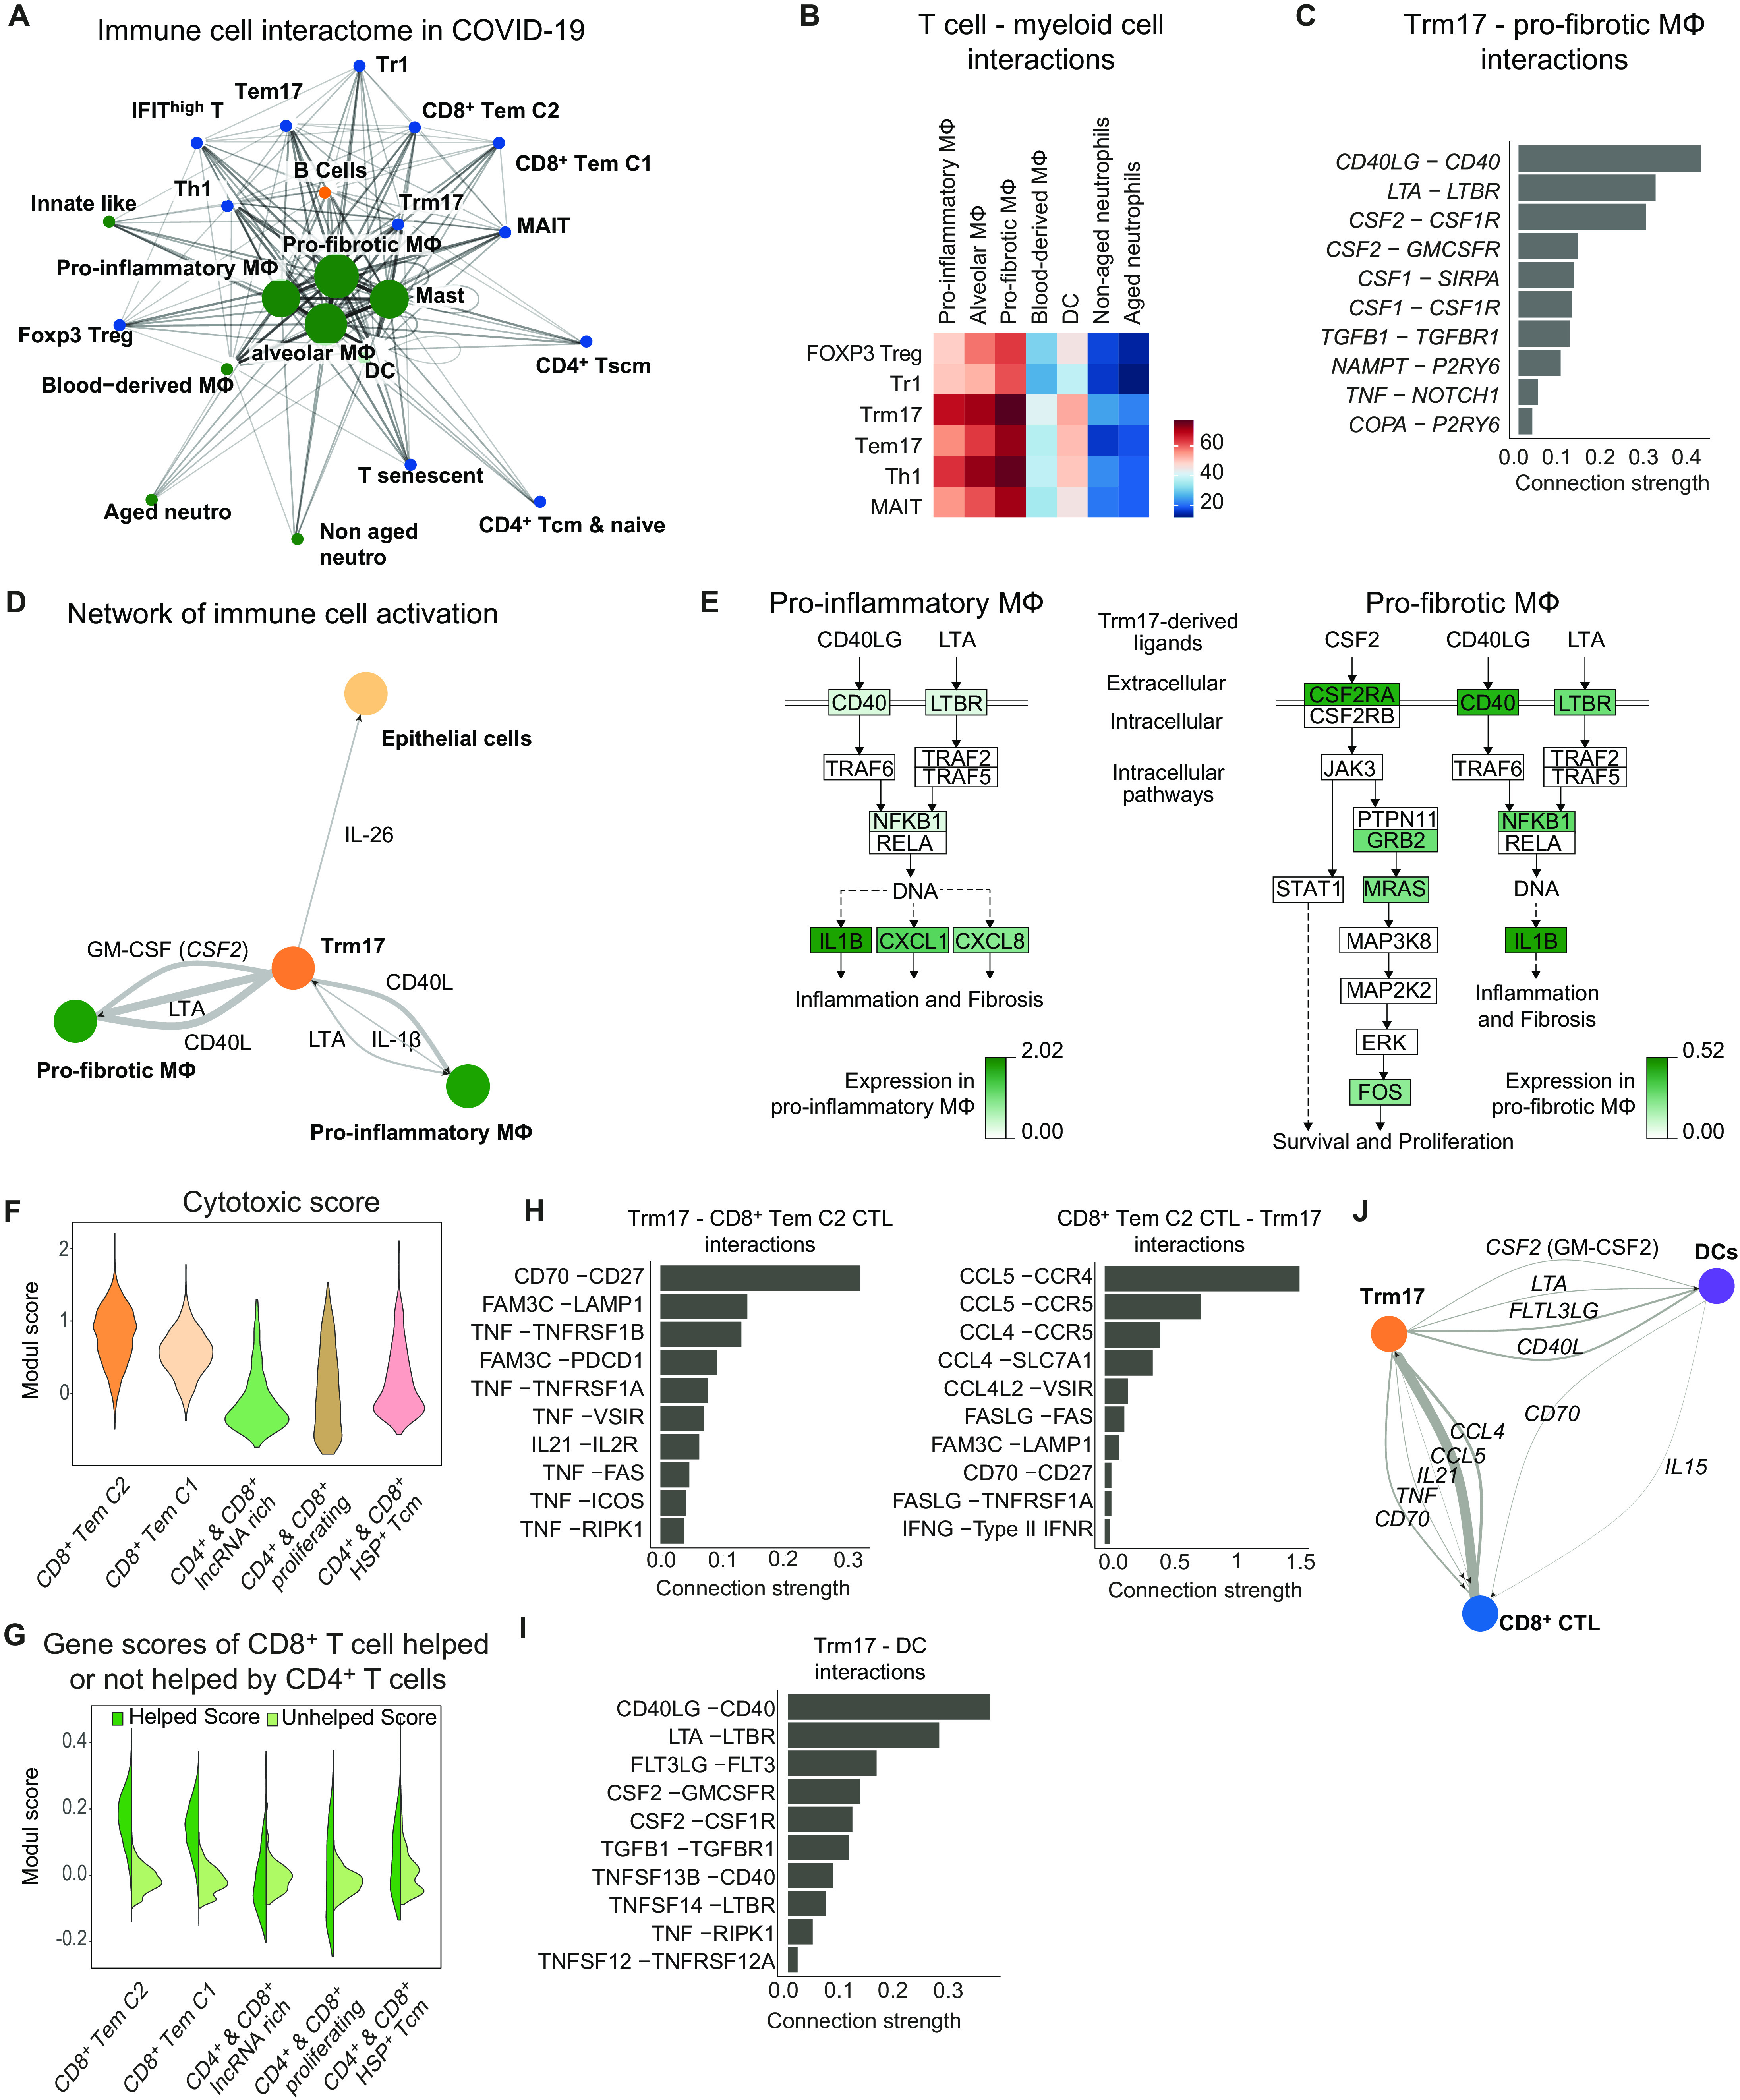
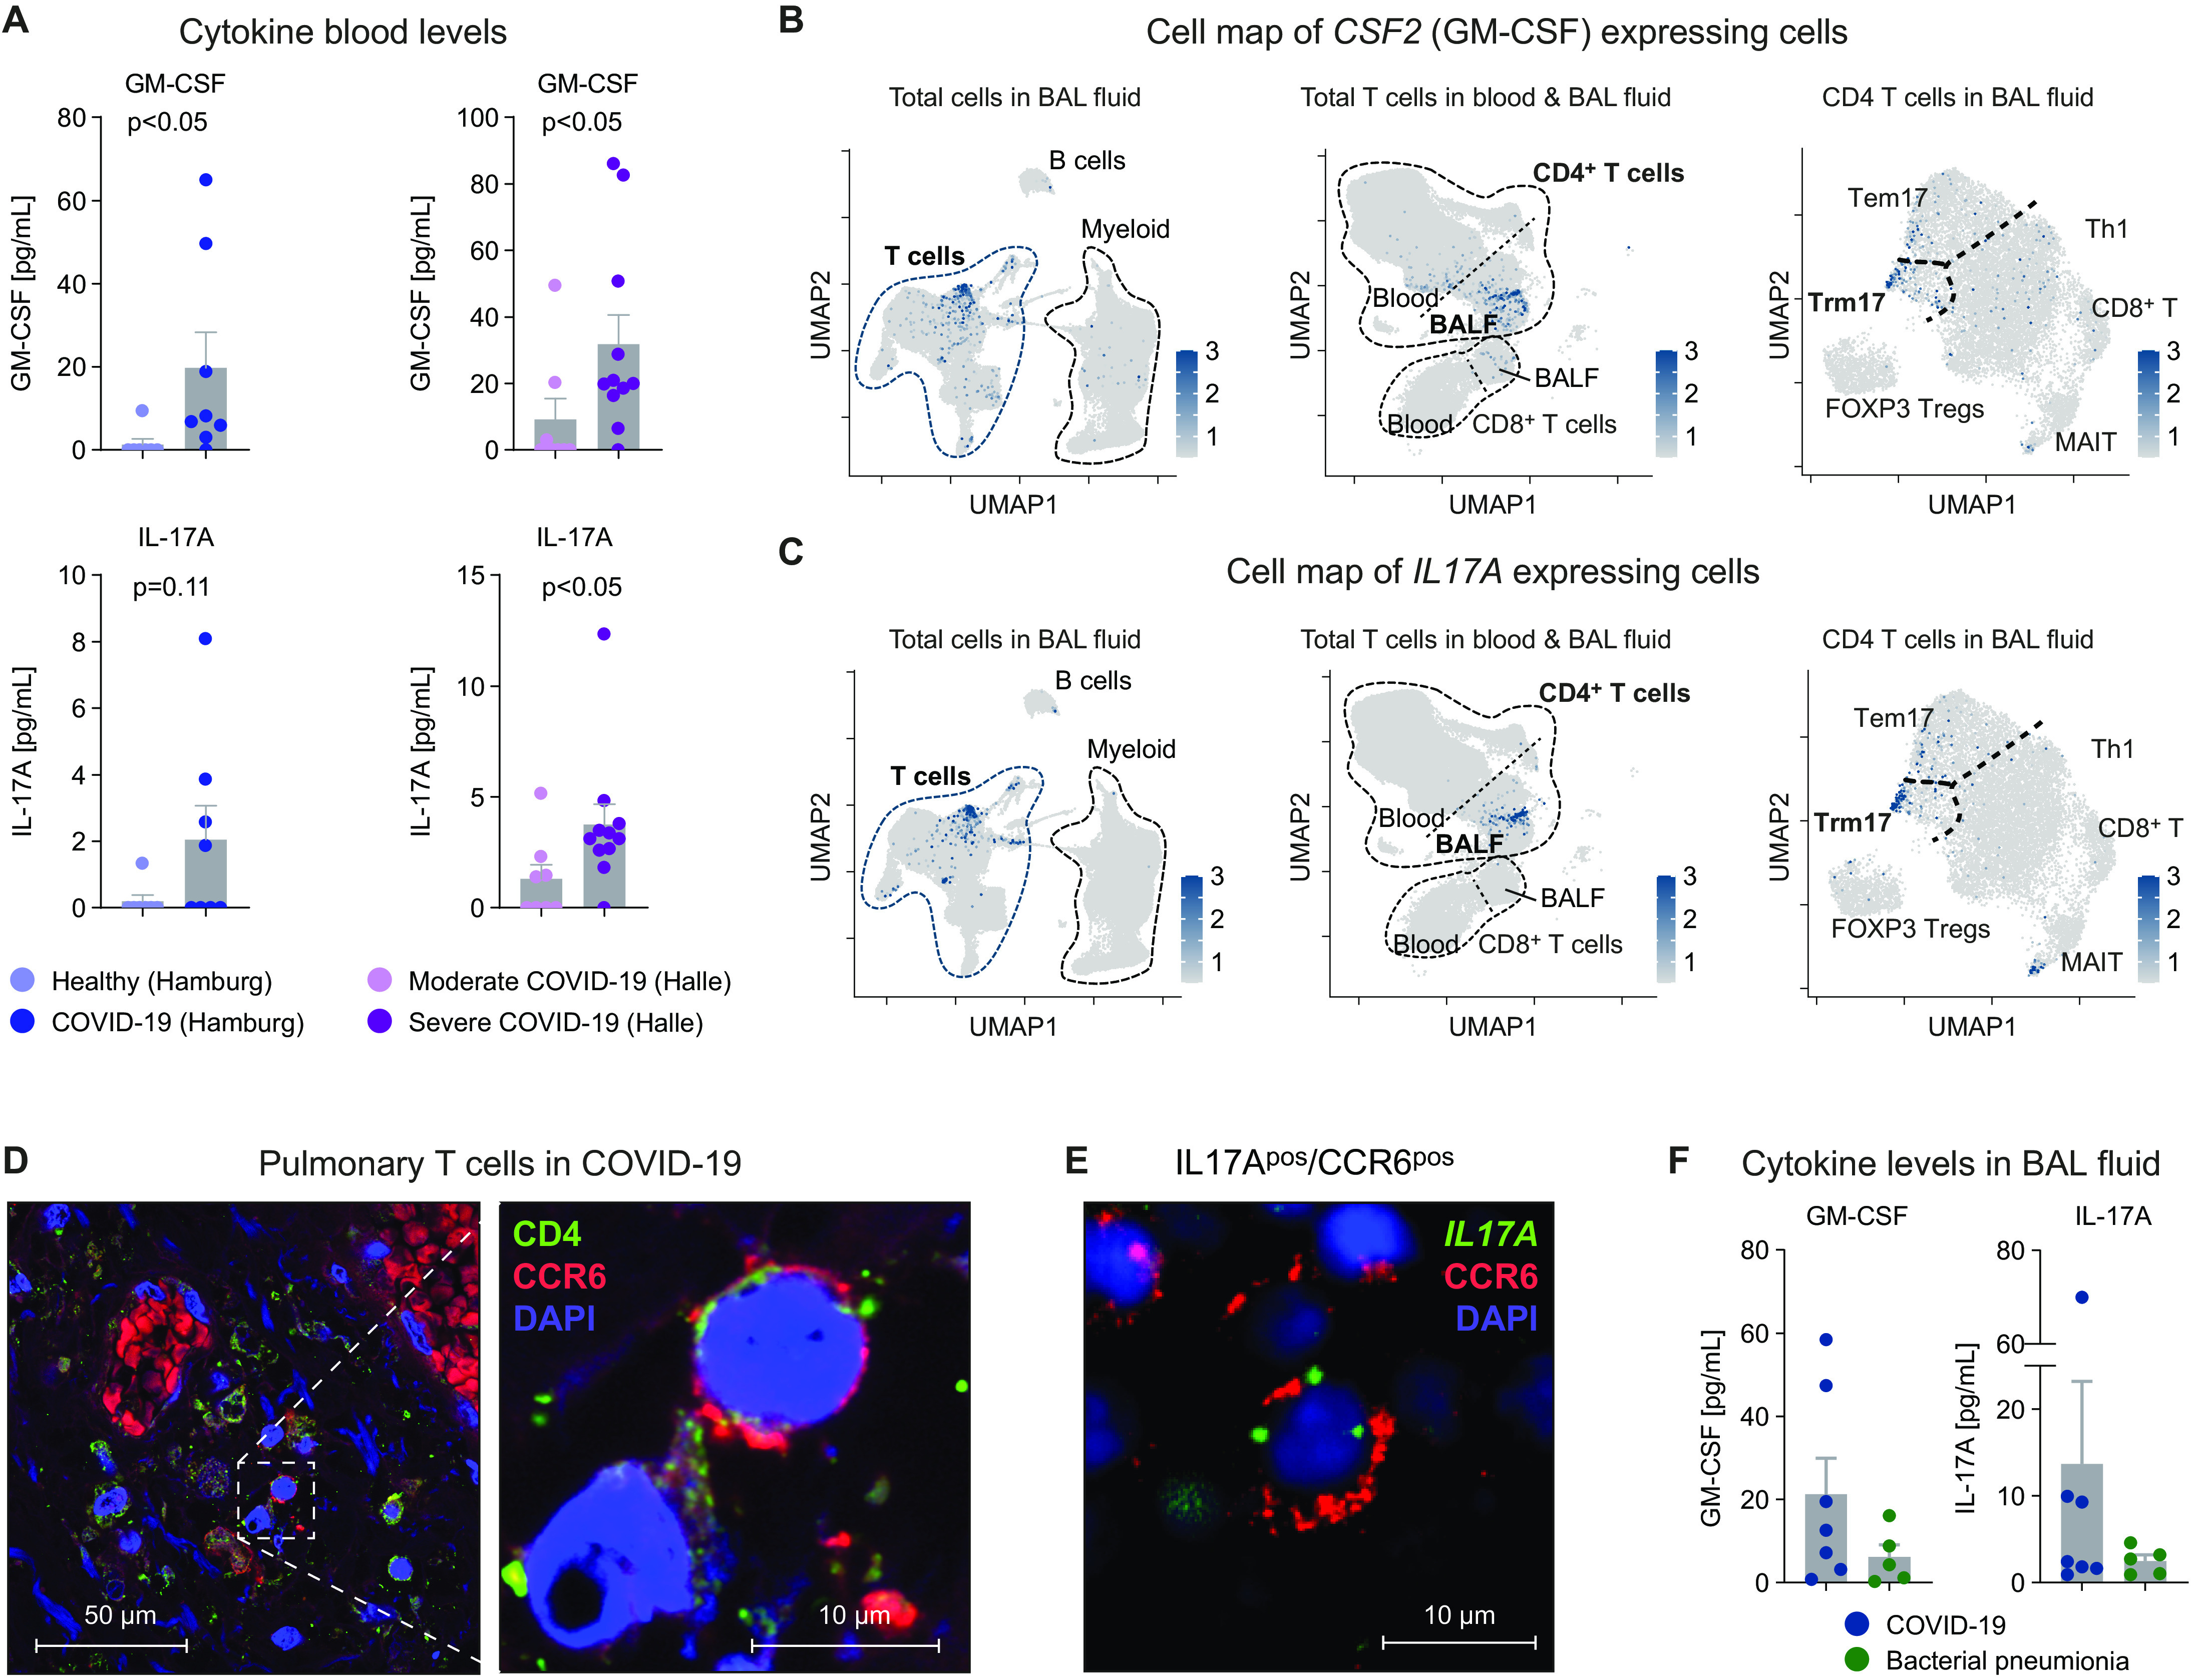
Hyperinflammation contributes to lung injury and subsequent acute respiratory distress syndrome (ARDS) with high mortality in patients with severe coronavirus disease 2019 (COVID-19). To understand the underlying mechanisms involved in lung pathology, we investigated the role of the lung-specific immune response. We profiled immune cells in bronchoalveolar lavage fluid and blood collected from COVID-19 patients with severe disease and bacterial pneumonia patients not associated with viral infection. By tracking T cell clones across tissues, we identified clonally expanded tissue-resident memory-like Th17 cells (Trm17 cells) in the lungs even after viral clearance. These Trm17 cells were characterized by a a potentially pathogenic cytokine expression profile of IL17A and CSF2 (GM-CSF). Interactome analysis suggests that Trm17 cells can interact with lung macrophages and cytotoxic CD8+ T cells, which have been associated with disease severity and lung damage. High IL-17A and GM-CSF protein levels in the serum of COVID-19 patients were associated with a more severe clinical course. Collectively, our study suggests that pulmonary Trm17 cells are one potential orchestrator of the hyperinflammation in severe COVID-19.
Copyright © 2021, American Association for the Advancement of Science.
Figures
Similar articles
-
Compartmental immunophenotyping in COVID-19 ARDS: A case series.J Allergy Clin Immunol. 2021 Jan;147(1):81-91. doi: 10.1016/j.jaci.2020.09.009. Epub 2020 Oct 23. J Allergy Clin Immunol. 2021. PMID: 32979342 Free PMC article. Clinical Trial.
-
Modulation of neutrophil apoptosis by granulocyte colony-stimulating factor and granulocyte/macrophage colony-stimulating factor during the course of acute respiratory distress syndrome.Crit Care Med. 2000 Jan;28(1):1-7. doi: 10.1097/00003246-200001000-00001. Crit Care Med. 2000. PMID: 10667491
-
G-CSF and IL-8 but not GM-CSF correlate with severity of pulmonary neutrophilia in acute respiratory distress syndrome.Eur Respir J. 2000 May;15(5):895-901. doi: 10.1034/j.1399-3003.2000.15e14.x. Eur Respir J. 2000. PMID: 10853855
-
Targeting GM-CSF in COVID-19 Pneumonia: Rationale and Strategies.Front Immunol. 2020 Jul 3;11:1625. doi: 10.3389/fimmu.2020.01625. eCollection 2020. Front Immunol. 2020. PMID: 32719685 Free PMC article. Review.
-
The Role of Th17 Response in COVID-19.Cells. 2021 Jun 19;10(6):1550. doi: 10.3390/cells10061550. Cells. 2021. PMID: 34205262 Free PMC article. Review.
Cited by
-
Single-Cell TCR Sequencing Reveals the Dynamics of T Cell Repertoire Profiling During Pneumocystis Infection.Front Microbiol. 2021 Apr 20;12:637500. doi: 10.3389/fmicb.2021.637500. eCollection 2021. Front Microbiol. 2021. PMID: 33959105 Free PMC article.
-
Immune responses in mildly versus critically ill COVID-19 patients.Front Immunol. 2023 Jan 30;14:1077236. doi: 10.3389/fimmu.2023.1077236. eCollection 2023. Front Immunol. 2023. PMID: 36793739 Free PMC article. Review.
-
Cellular and molecular features of COVID-19 associated ARDS: therapeutic relevance.J Inflamm (Lond). 2023 Mar 20;20(1):11. doi: 10.1186/s12950-023-00333-2. J Inflamm (Lond). 2023. PMID: 36941580 Free PMC article. Review.
-
Cytokine Kinetics during Progression of COVID-19 in Rwanda Patients: Could IL-9/IFNγ Ratio Predict Disease Severity?Int J Mol Sci. 2023 Jul 31;24(15):12272. doi: 10.3390/ijms241512272. Int J Mol Sci. 2023. PMID: 37569646 Free PMC article.
-
Deciphering the Plasmodium falciparum malaria-specific CD4+ T-cell response: ex vivo detection of high frequencies of PD-1+TIGIT+ EXP1-specific CD4+ T cells using a novel HLA-DR11-restricted MHC class II tetramer.Clin Exp Immunol. 2022 Apr 4;207(2):227-236. doi: 10.1093/cei/uxab027. Clin Exp Immunol. 2022. PMID: 35020841 Free PMC article.
References
-
- Temesgen Z., Assi M., Shweta F. N. U., Vergidis P., Rizza S. A., Bauer P. R., Pickering B. W., Razonable R. R., Libertin C. R., Burger C. D., Orenstein R., Vargas H. E., Palraj R., Dababneh A. S., Chappell G., Chappell D., Ahmed O., Sakemura R., Durrant C., Kenderian S. S., Badley A. D., GM-CSF neutralization with lenzilumab in severe COVID-19 pneumonia: A case-control study. Mayo Clin. Proc. 95, 2382–2394 (2020). - PMC - PubMed
-
- De Luca G., Cavalli G., Campochiaro C., Della-Torre E., Angelillo P., Tomelleri A., Boffini N., Tentori S., Mette F., Farina N., Rovere-Querini P., Ruggeri A., D'Aliberti T., Scarpellini P., Landoni G., De Cobelli F., Paolini J. F., Zangrillo A., Tresoldi M., Trapnell B. C., Ciceri F., Dagna L., GM-CSF blockade with mavrilimumab in severe COVID-19 pneumonia and systemic hyperinflammation: A single-centre, prospective cohort study. Lancet Rheumatol 2, e465–e473 (2020). - PMC - PubMed
-
- Huet T., Beaussier H., Voisin O., Jouveshomme S., Dauriat G., Lazareth I., Sacco E., Naccache J.-M., Bézie Y., Laplanche S., Berre A. L., Pavec J. L., Salmeron S., Emmerich J., Mourad J.-J., Chatellier G., Hayem G., Anakinra for severe forms of COVID-19: A cohort study. Lancet Rheumatol 2, e393–e400 (2020). - PMC - PubMed
Publication types
MeSH terms
Substances
LinkOut - more resources
Full Text Sources
Other Literature Sources
Medical
Molecular Biology Databases
Research Materials
