. 2021 Feb 23;6(56):eabg6916.
doi: 10.1126/sciimmunol.abg6916.

Prolonged evolution of the human B cell response to SARS-CoV-2 infection

Affiliations

Prolonged evolution of the human B cell response to SARS-CoV-2 infection

Mrunal Sakharkar et al. Sci Immunol. .

Abstract

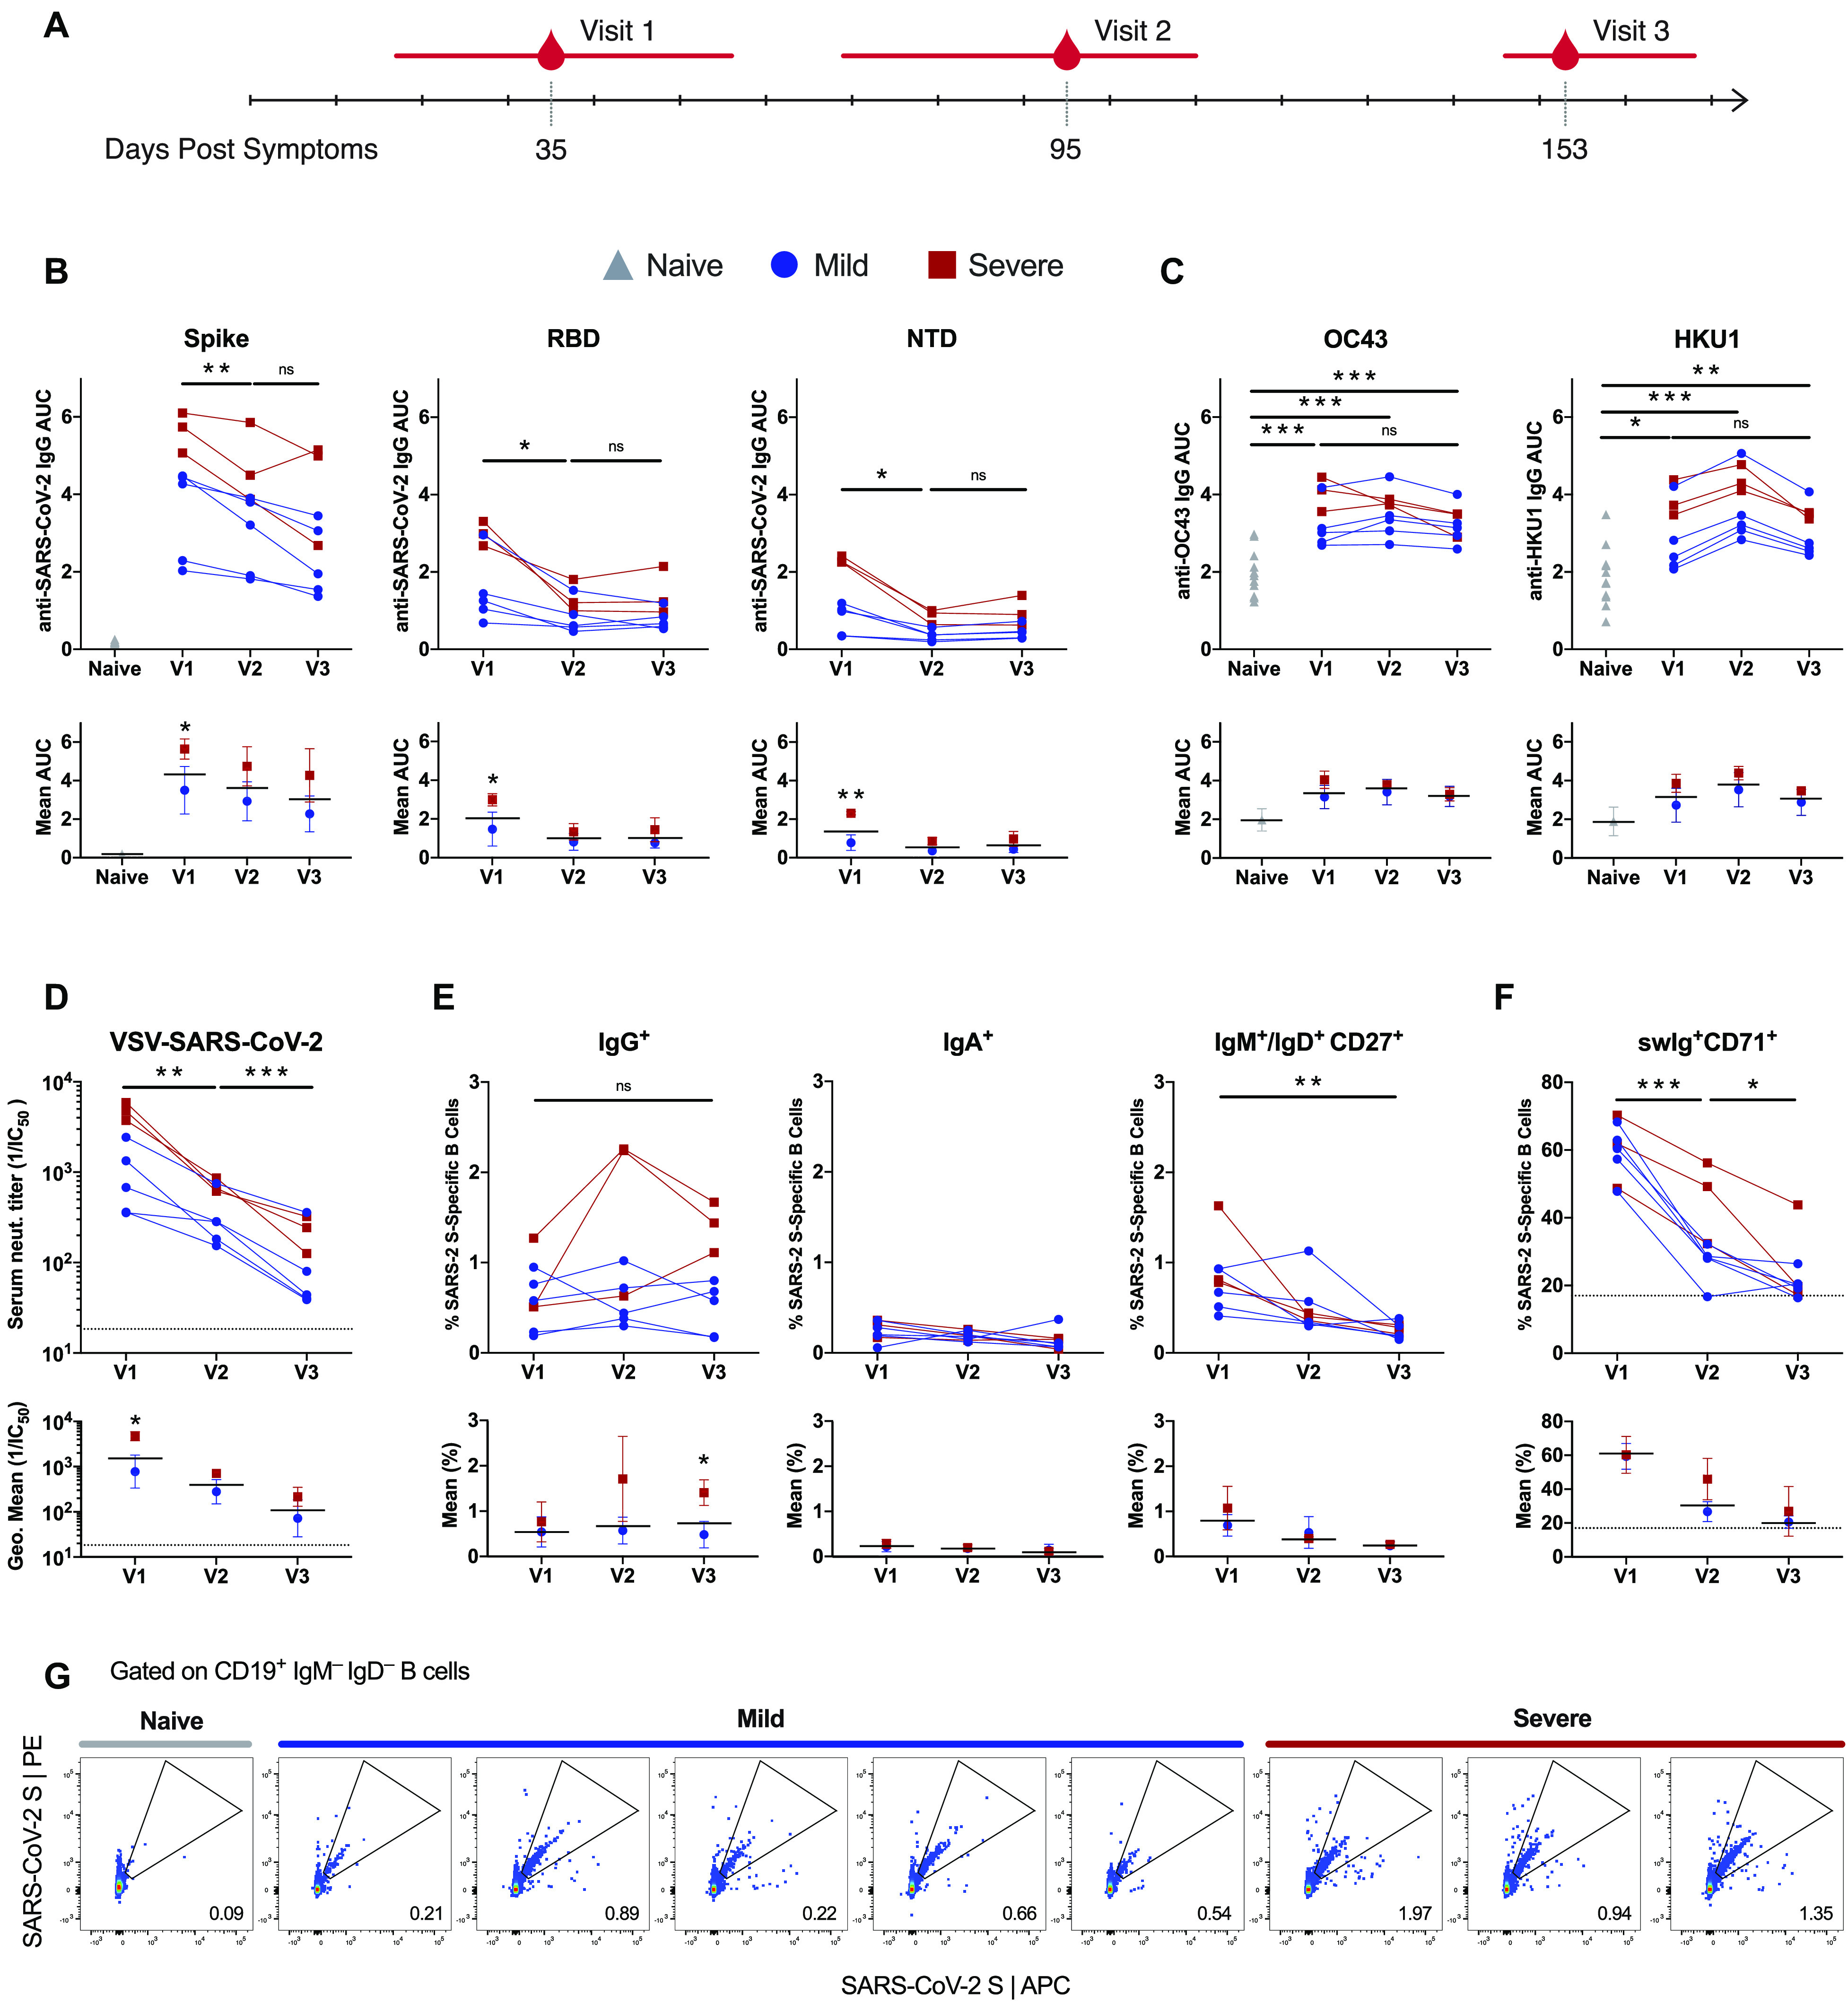
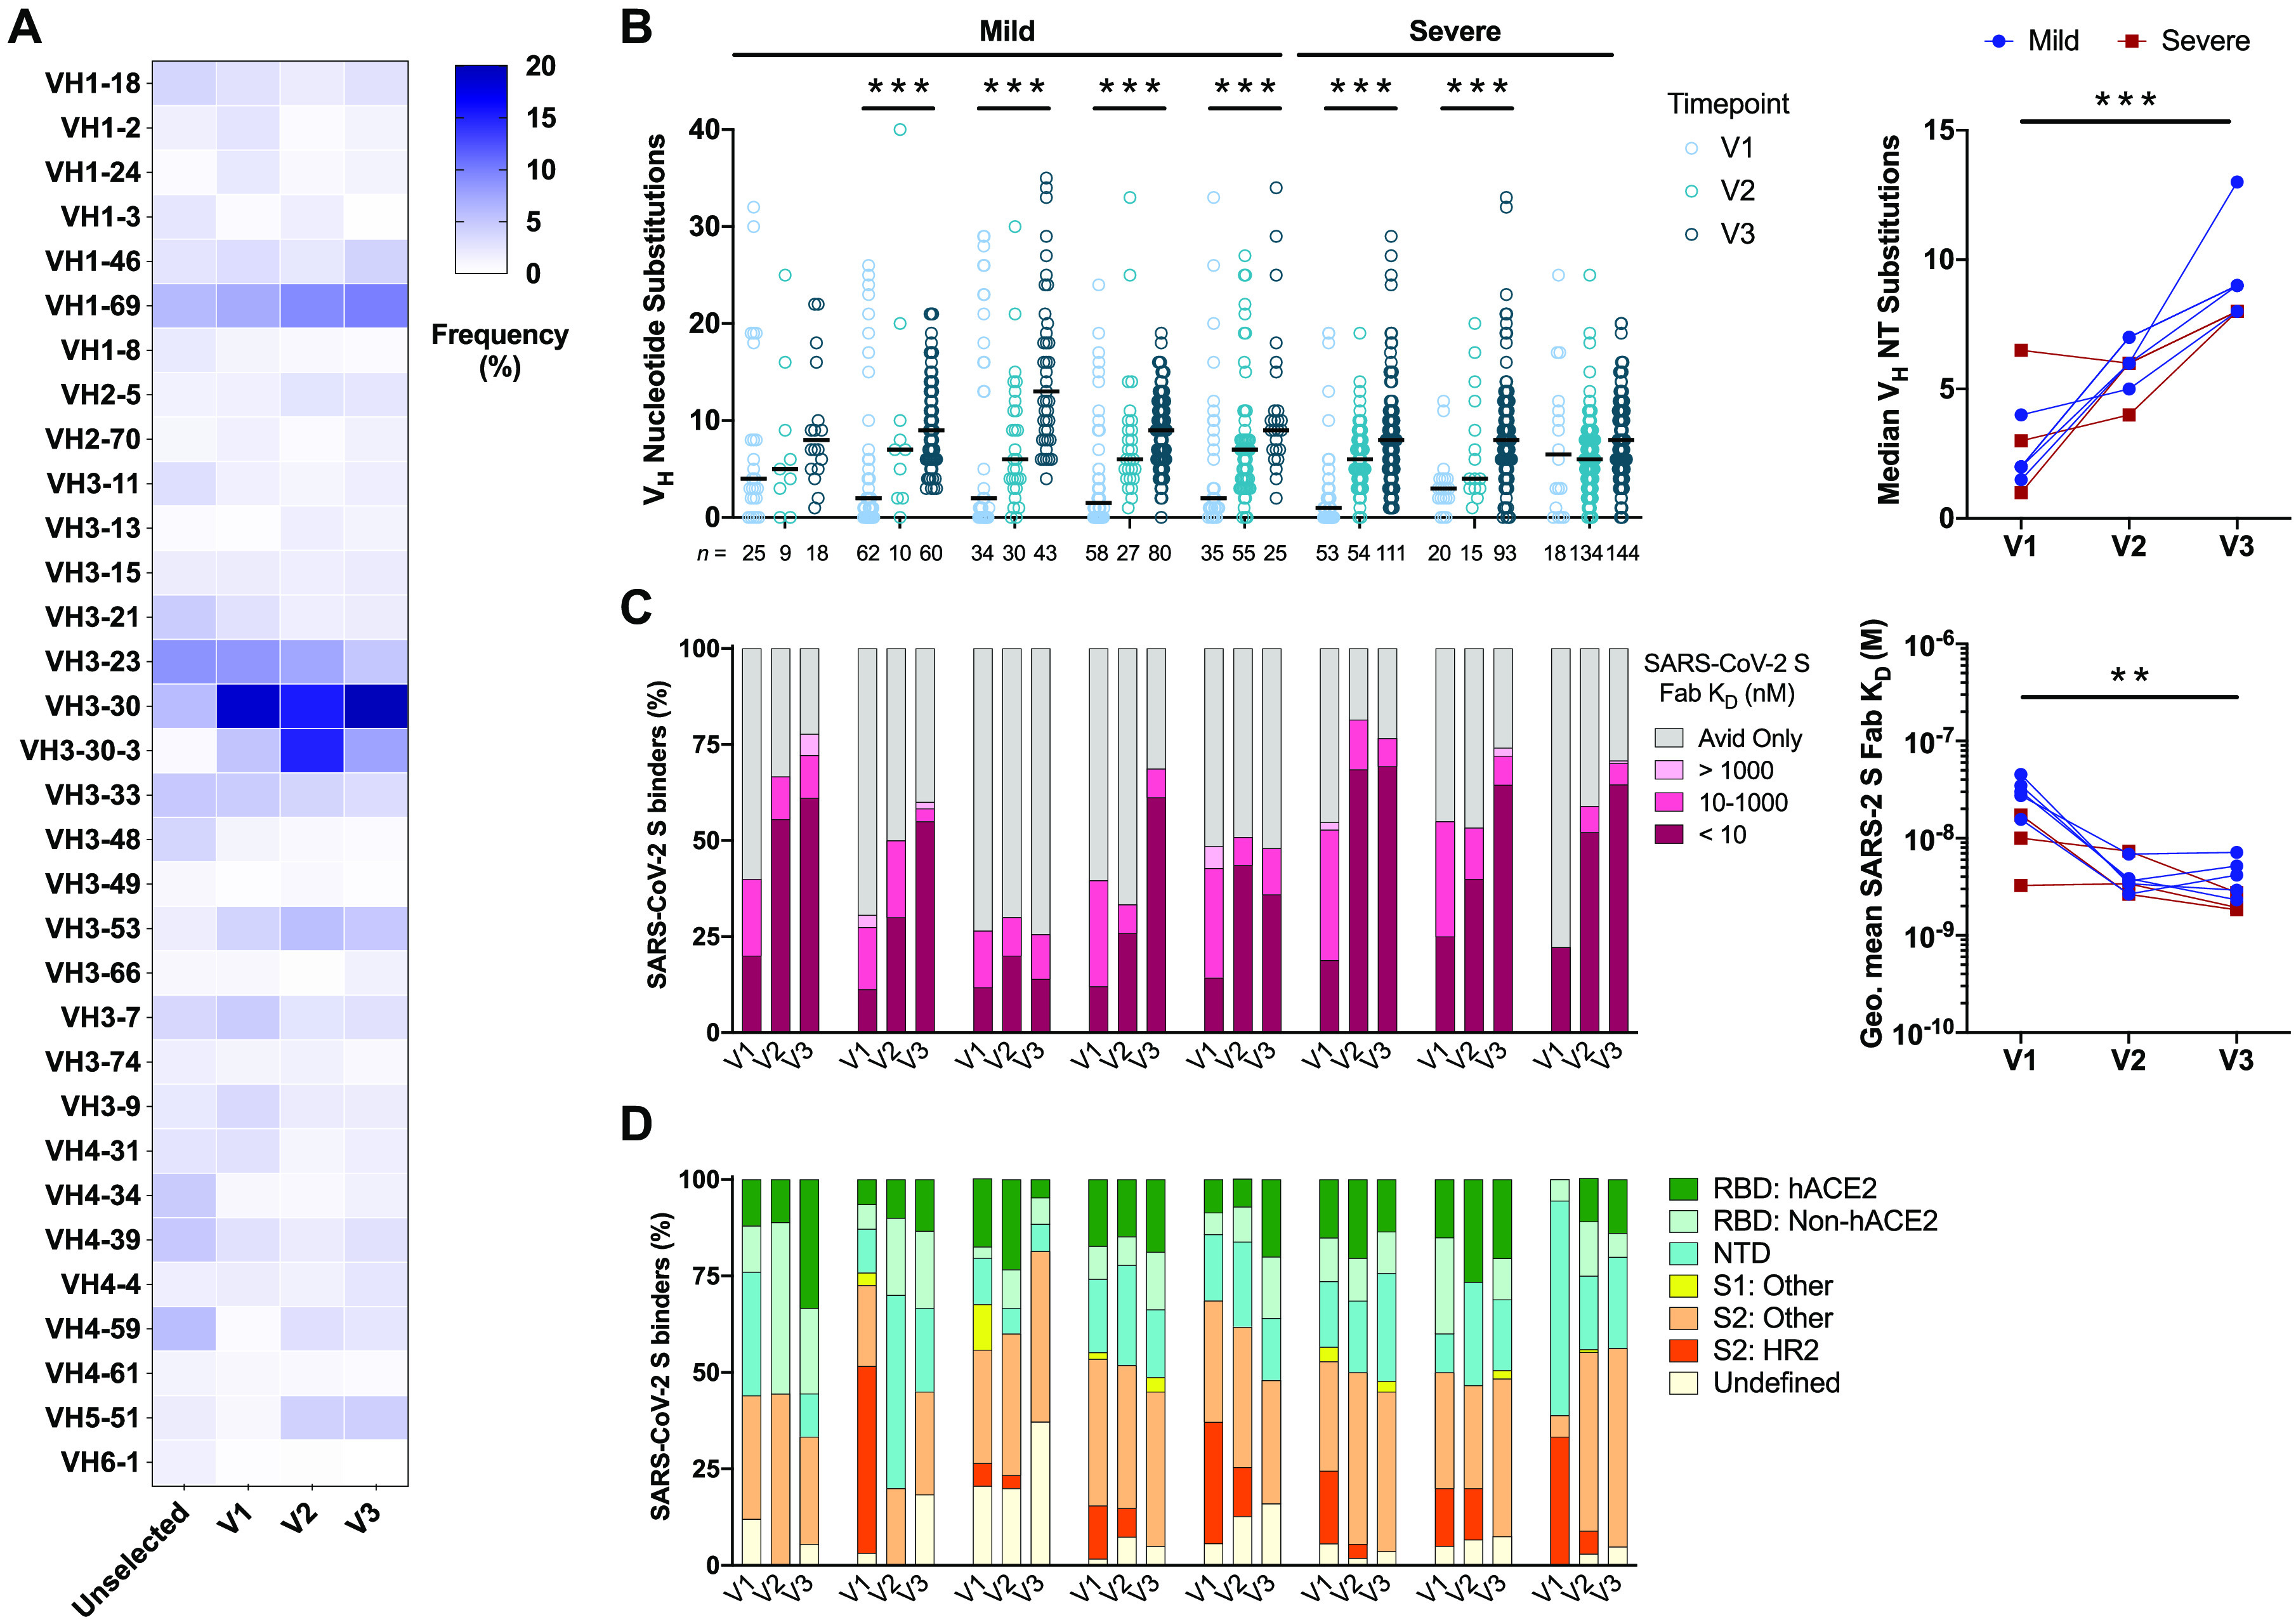
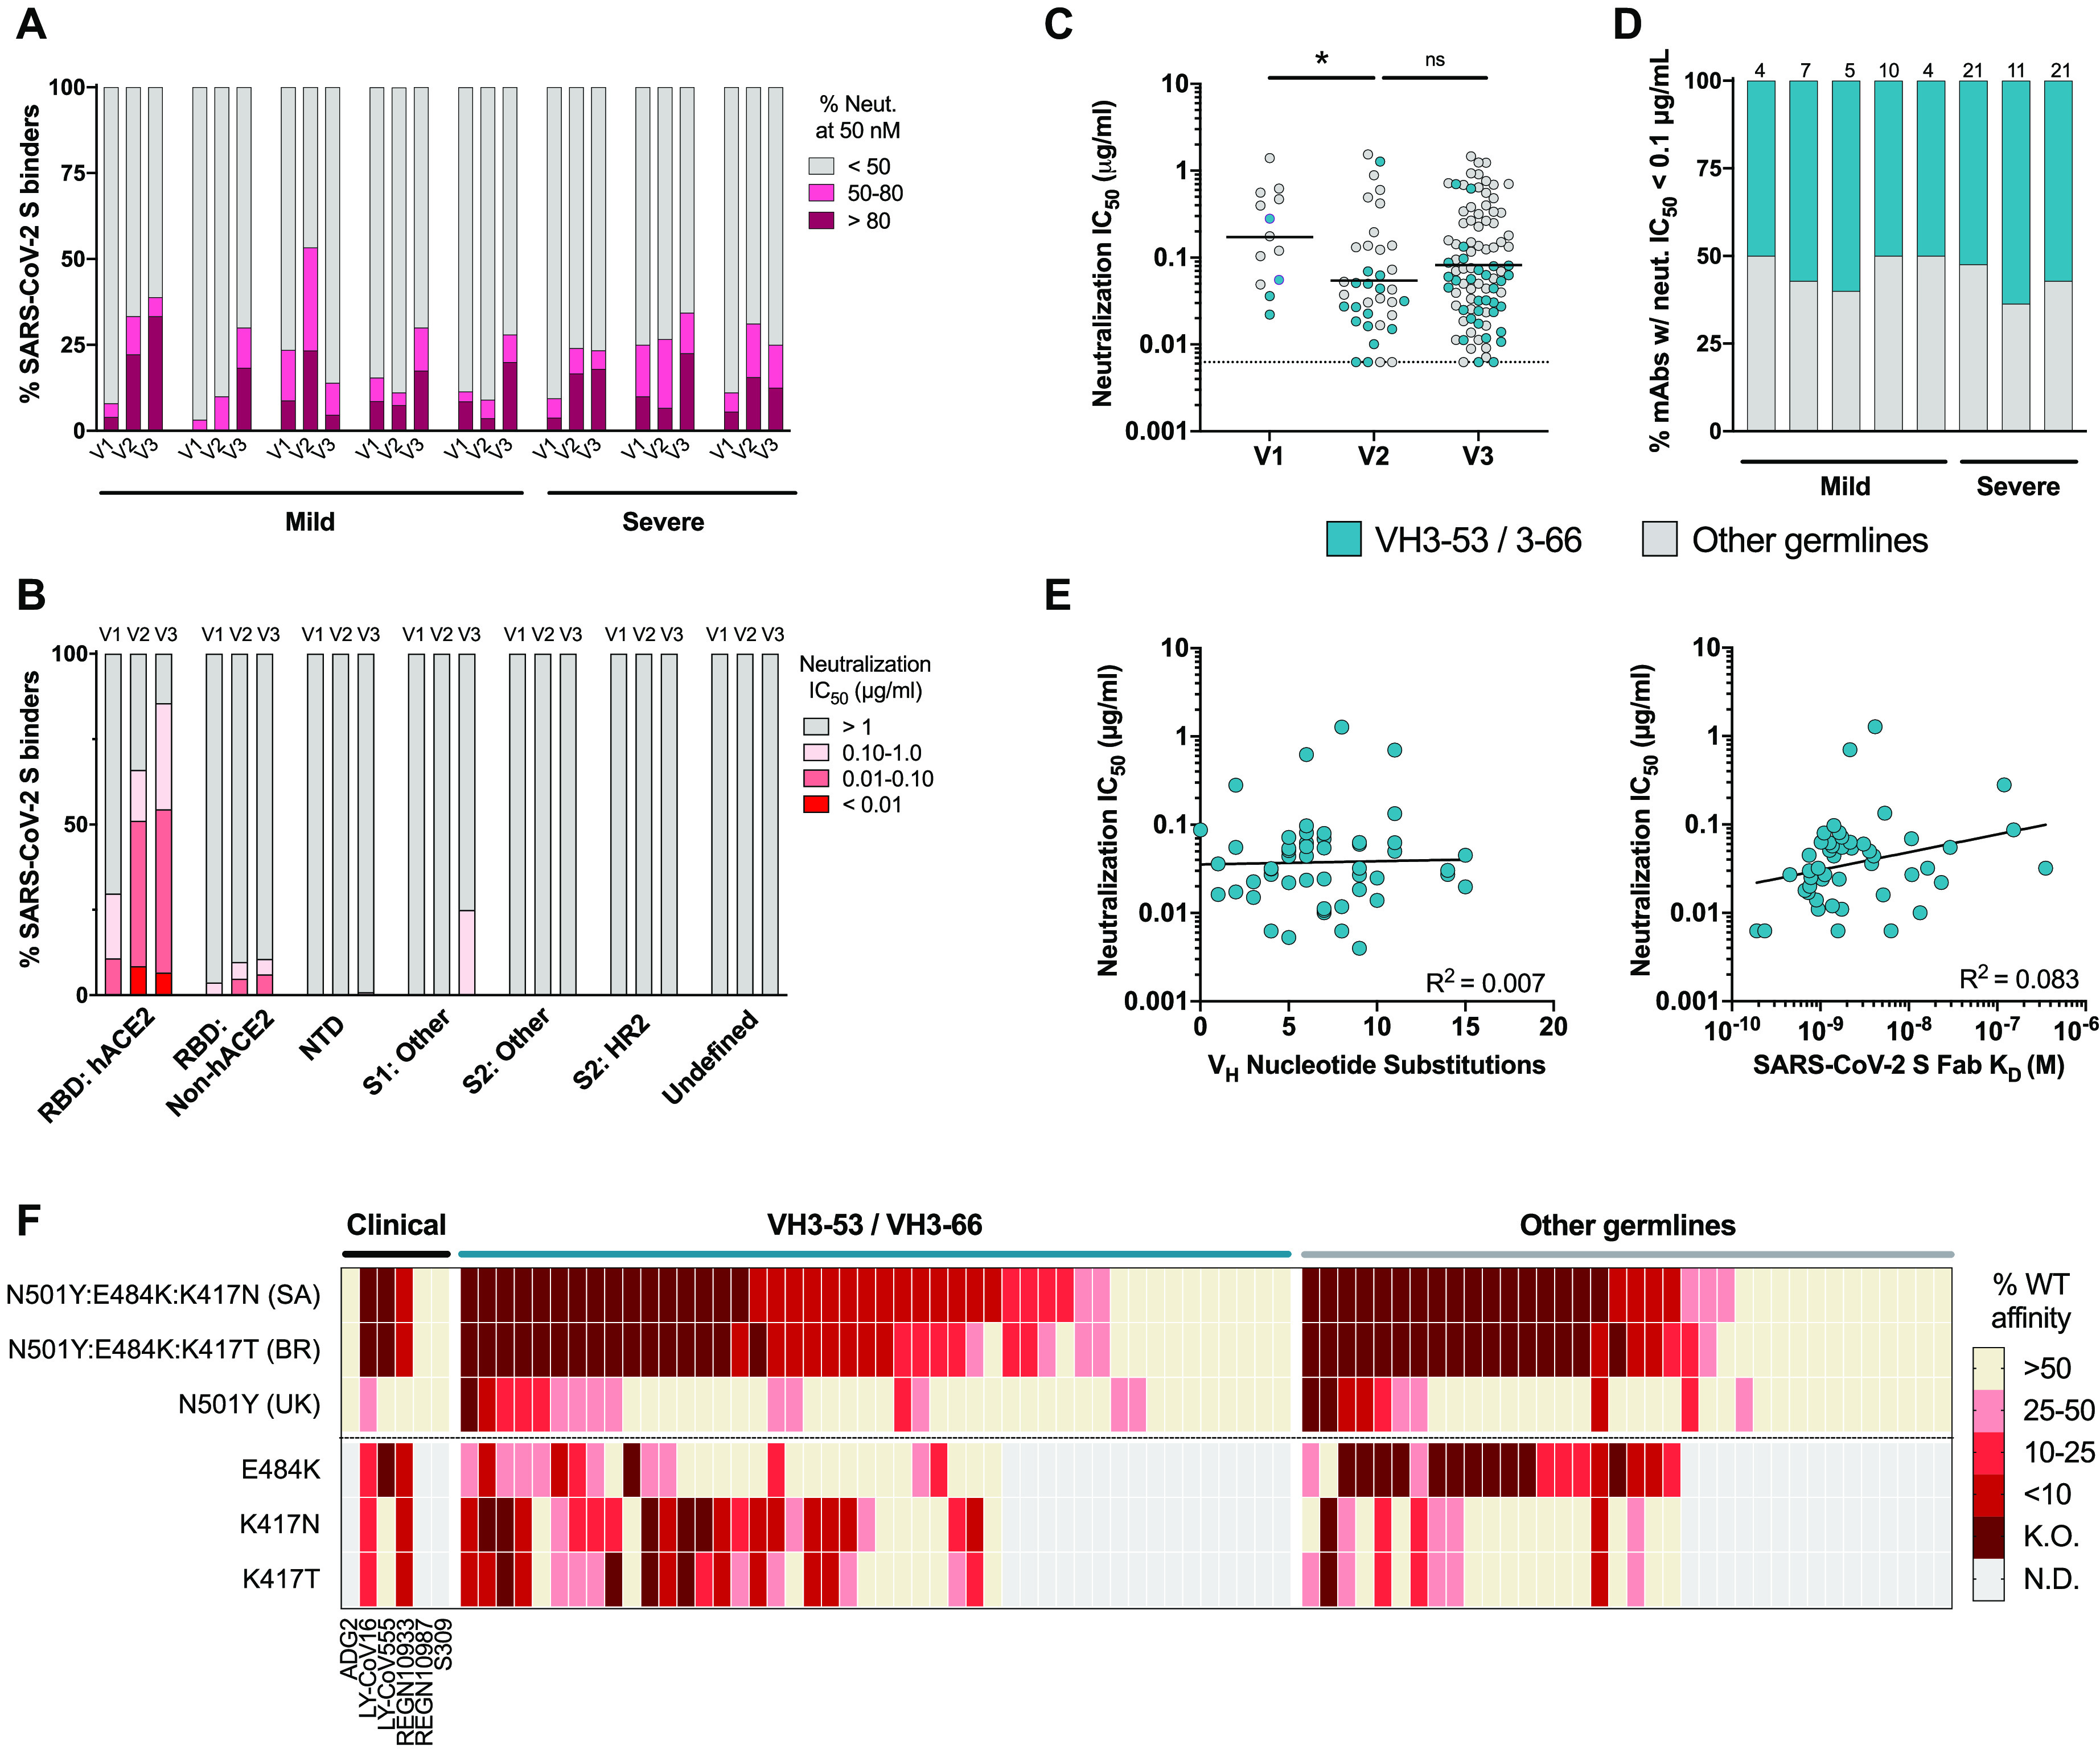
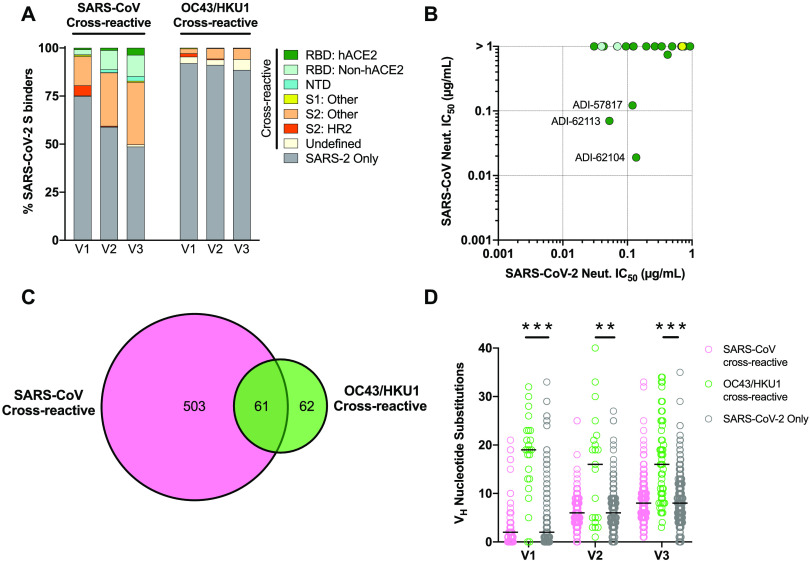
A comprehensive understanding of the kinetics and evolution of the human B cell response to SARS-CoV-2 infection will facilitate the development of next-generation vaccines and therapies. Here, we longitudinally profiled this response in mild and severe COVID-19 patients over a period of five months. Serum neutralizing antibody (nAb) responses waned rapidly but spike (S)-specific IgG+ memory B cells (MBCs) remained stable or increased over time. Analysis of 1,213 monoclonal antibodies (mAbs) isolated from S-specific MBCs revealed a primarily de novo response that displayed increased somatic hypermutation, binding affinity, and neutralization potency over time, providing evidence for prolonged antibody affinity maturation. B cell immunodominance hierarchies were similar across donor repertoires and remained relatively stable as the immune response progressed. Cross-reactive B cell populations, likely re-called from prior endemic beta-coronavirus exposures, comprised a small but stable fraction of the repertoires and did not contribute to the neutralizing response. The neutralizing antibody response was dominated by public clonotypes that displayed significantly reduced activity against SARS-CoV-2 variants emerging in Brazil and South Africa that harbor mutations at positions 501, 484 and 417 in the S protein. Overall, the results provide insight into the dynamics, durability, and functional properties of the human B cell response to SARS-CoV-2 infection and have implications for the design of immunogens that preferentially stimulate protective B cell responses.


Figures

Fig. 1
Fig. 1. Longitudinal analysis of anti-SARS-CoV-2 serum and memory B cell responses.
(A) Blood samples were collected at the indicated time points post-symptom onset. The values underneath the timeline indicate medians and the red bars indicate ranges. (B-C) Serum IgG binding to SARS-CoV-2 (B) and endemic β-CoV (C) S protein antigens, as assessed by ELISA (top). Mean IgG binding titers in donors with mild and severe COVID-19 (bottom). Twelve pre-pandemic naive donor samples are included as controls. Error bars denote standard deviation and black bars indicate means. (D) Serum VSV-SARS-CoV-2 neutralizing titers for each donor at the three sampling timepoints (top). Geometric mean serum neutralizing titers in mild and severe donor samples (bottom). Error bars denote geometric standard deviation and black bars indicate geometric means. The dotted line indicates the lower limit of detection. (E) Frequencies of SARS-CoV-2 S-specific IgG+, IgA+, and IgM+ and/or IgD+CD27+ B cells at each sampling time point (top). Mean frequencies of SARS-CoV-2 S-specific B cells expressing the indicated isotype in mild and severe donors (bottom). Error bars denote standard deviation and black bars indicate means. (F) Proportion of SARS-CoV-2 S-specific swIg+ B cells that express CD71 at each sampling time point (top). Mean frequencies of SARS-CoV-2 S-specific swIg+CD71+ B cells in mild and severe donors (bottom). Error bars denote standard deviation and black bars indicate means. The dotted line indicates the level of CD71 expression on swIg+ B cells in pre-pandemic donor samples. (G) Representative gating for SARS-CoV-2 S-specific B cells. The gated populations were single cell sorted for mAb cloning. Statistical comparisons between naive and convalescent donors were made by two-sided one-way Welsh ANOVA for unpaired samples with Dunnett’s T3 multiple comparisons test. Statistical comparisons between timepoints among convalescent donors were performed by two-sided two-way ANOVA for paired samples with Tukey’s multiple comparisons test. Statistical comparisons between mild and severe convalescent donor cohorts at each timepoint were performed by two-sided two-way ANOVA with Sidak’s multiple comparisons test. *, P < 0.05; **, P < 0.01, ***, P < 0.001; ns, not significant; AUC, area under the curve.
Fig. 2
Fig. 2. SARS-CoV-2 S-specific antibody sequencing and binding characteristics.
(A) VH germline gene usage of SARS-CoV-2 S-specific mAbs isolated at each sampling time point. VH germline gene frequencies of unselected human MBCs (Unselected) were obtained from high-throughput sequencing studies and shown for comparison (44). (B) SHM loads of SARS-CoV-2 S-specific mAbs isolated from each donor at Visits 1-3 (left), with the number of mAbs analyzed per timepoint displayed below the axis. Statistical comparisons were performed by two-sided Kruskal-Wallis tests with Dunn’s multiple comparisons test. Median number of VH nucleotide substitutions in SARS-CoV-2 S-specific mAbs isolated from each donor at Visits 1-3 (right). Statistical comparisons were made by two-sided Friedman test with Dunn’s multiple comparisons test. Black bars indicate medians. (C) Proportion of SARS-CoV-2 S-specific mAbs isolated at each time point with the indicated Fab binding affinities. The avid-only group contains mAbs that bound to SARS-CoV-2 S in an avid but not monovalent orientation (left). Geometric mean Fab binding affinities of SARS-CoV-2 S-specific MAbs isolated from each donor at Visits 1-3 (right). MAbs that did not display detectable Fab binding are excluded from this analysis. Statistical comparisons were made by two-sided Friedman test with Dunn’s multiple comparisons test. (D) Proportion of SARS-CoV-2 S-specific mAbs isolated at Visits 1-3 that target the indicated antigenic sites. RBD: hACE2, RBD-directed and hACE2 competitive; RBD: non-hACE2, RBD-directed and hACE2 non-competitive; S1: Other, S1-reactive but non-reactive with isolated NTD or RBD proteins; S2: Other, reactive with S2 and SΔHR2; S2: HR2, reactive with S2 but not SΔHR2. NT, nucleotide. **, P < 0.01, ***, P < 0.001.
Fig. 3
Fig. 3. Longitudinal analysis of the neutralizing antibody response to SARS-CoV-2.
(A) Proportion of SARS-CoV-2 S binding mAbs isolated at Visits 1-3 with the indicated level of VSV-SARS-CoV-2 neutralizing activity at a concentration of 50 nM. (B) Proportion of mAbs targeting each of the indicated antigenic sites that display the indicated neutralization potencies. (C) VSV-SARS-CoV-2 neutralization IC50s of mAbs isolated at Visits 1-3 that displayed >80% neutralizing activity in the initial screen. MAbs utilizing either VH3-53/3-66 or other VH germline genes are shown in teal and grey, respectively. Statistical comparisons were performed by two-sided Kruskal-Wallis tests with Dunn’s multiple comparisons test. The dotted line indicates the lower limit of detection. Black bars indicate geometric means. (D) Proportion of potently neutralizing mAbs from each donor that utilize either VH3-53/3-66 or other VH germline genes. The number of mAbs analyzed are shown above the bar. (E) Correlation between VSV-SARS-CoV-2 neutralization IC50 and SHM load (left) or SARS-CoV-2 S binding affinity (right) for VH3-53/3-66 class mAbs. R2 values were generated by linear regression analysis. (F) Fab binding activities of 82 potently neutralizing antibodies (VSV-SARS-CoV-2 IC50 < 0.1 μg/ml) to yeast displayed RBDs containing the indicated amino acid substitutions. Amino acid substitutions were derived from emerging SARS-CoV-2 isolates in South Africa (SA, B.1.351/501Y.V2), Brazil (BR, B.1.1.28/501Y.V3), or the United Kingdom (UK, B.1.1.7/501Y.V1). Values indicate the percent Fab binding affinity to the mutant RBD relative to Wuhan-1 (WT) SARS-CoV-2 RBD. Clinical-stage SARS-CoV-2 antibodies are included as controls. K.O. indicates binding below the limit of detection. K.O., knock-out. WT, wild-type. *, P < 0.05; ns, not significant.
Fig. 4
Fig. 4. Cross-reactivity properties of anti-SARS-CoV-2 S mAbs.
(A) Proportion of SARS-CoV-2 S-specific mAbs isolated at Visits 1-3 that cross-react with the SARS-CoV (left) or endemic β-CoV (right) S proteins, averaged across all donors. MAbs that showed cross-reactivity with OC43 and/or HKU1 S are grouped together and designated OC43/HKU1. The antigenic sites targeted by the cross-reactive mAbs are indicated with colors, as defined in the legend. All SARS-CoV-2 monospecific mAbs are grouped together and shown as a single dark grey segment. (B) VSV-SARS-CoV and VSV-SARS-CoV-2 neutralization IC50s for all SARS-CoV cross-reactive mAbs that displayed a SARS-CoV-2 neutralization IC50 < 1 μg/ml. Colors correspond to antigenic sites as defined in (A). (C) Venn diagram showing the cross-reactivity profiles of mAbs isolated at Visits 1-3. All time points are pooled for this analysis. (D) SHM loads of cross-reactive and SARS-CoV-2 monospecific mAbs isolated at Visits 1-3. Statistical comparisons were made by two-sided Kruskal-Wallis tests with Dunn’s multiple comparisons test. Black bars indicate medians. **, P < 0.01; ***, P< 0.001.

Similar articles

Cited by

References

    1. Eguia R., Crawford K. H. D., Stevens-Ayers T., Kelnhofer-Millevolte L., Greninger A. L., Englund J. A., Boeckh M. J., Bloom J. D., A human coronavirus evolves antigenically to escape antibody immunity. bioRxiv, 2020.2012.2017.423313 (2020). - PMC - PubMed
    1. Andreano E., Piccini G., Licastro D., Casalino L., Johnson N. V., Paciello I., Monego S. D., Pantano E., Manganaro N., Manenti A., Manna R., Casa E., Hyseni I., Benincasa L., Montomoli E., Amaro R. E., McLellan J. S., Rappuoli R., SARS-CoV-2 escape in vitro from a highly neutralizing COVID-19 convalescent plasma. bioRxiv 2020.2012.2028.424451 (2020). - PMC - PubMed
    1. Greaney A. J., Loes A. N., Crawford K. H. D., Starr T. N., Malone K. D., Chu H. Y., Bloom J. D., Comprehensive mapping of mutations to the SARS-CoV-2 receptor-binding domain that affect recognition by polyclonal human serum antibodies. bioRxiv, 2020.2012.2031.425021 (2021). - PMC - PubMed
    1. Kemp S. A., Collier D. A., Datir R., Ferreira I., Gayed S., Jahun A., Hosmillo M., Rees-Spear C., Mlcochova P., Lumb I. U., Roberts D. J., Chandra A., Temperton N., Sharrocks K., Blane E., Briggs J., van Gils M. J., Smith K., Bradley J. R., Smith C., Doffinger R., Ceron-Gutierrez L., Barcenas-Morales G., Pollock D. D., Goldstein R. A., Smielewska A., Skittrall J. P., Gouliouris T., Goodfellow I. G., Gkrania-Klotsas E., Illingworth C., McCoy L. E., Gupta R. K., Neutralising antibodies in Spike mediated SARS-CoV-2 adaptation. medRxiv 2020.2012.2005.20241927 (2020). - PubMed
    1. Wang P., Liu L., Iketani S., Luo Y., Guo Y., Wang M., Yu J., Zhang B., Kwong P. D., Graham B. S., Mascola J. R., Chang J. Y., Yin M. T., Sobieszczyk M., Kyratsous C. A., Shapiro L., Sheng Z., Nair M. S., Huang Y., Ho D. D., Increased Resistance of SARS-CoV-2 Variants B.1.351 and B.1.1.7 to Antibody Neutralization. bioRxiv 2021.2001.2025.428137 (2021). - PubMed

Publication types