. 2021 Feb 23;12(1):1233.
doi: 10.1038/s41467-021-21496-7.

Climate predicts geographic and temporal variation in mosquito-borne disease dynamics on two continents

Affiliations

Climate predicts geographic and temporal variation in mosquito-borne disease dynamics on two continents

Jamie M Caldwell et al. Nat Commun. .

Abstract

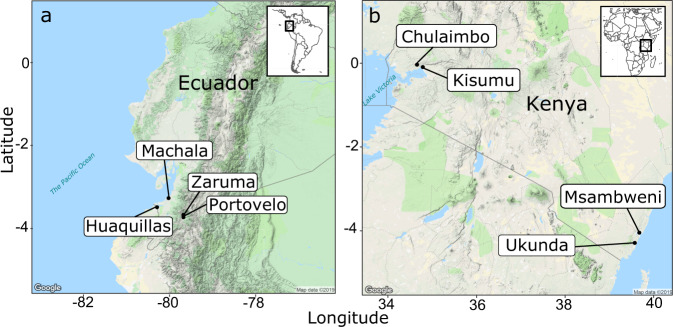
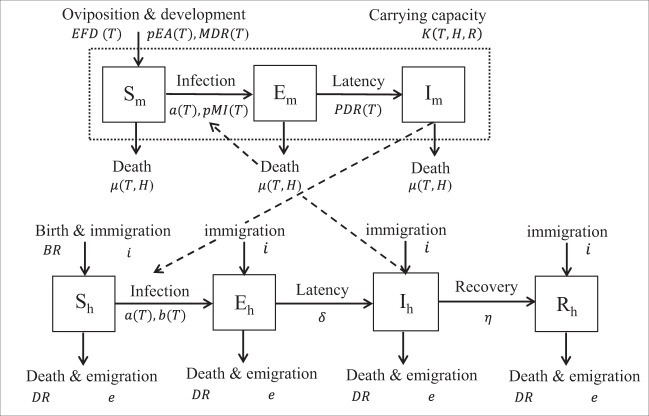
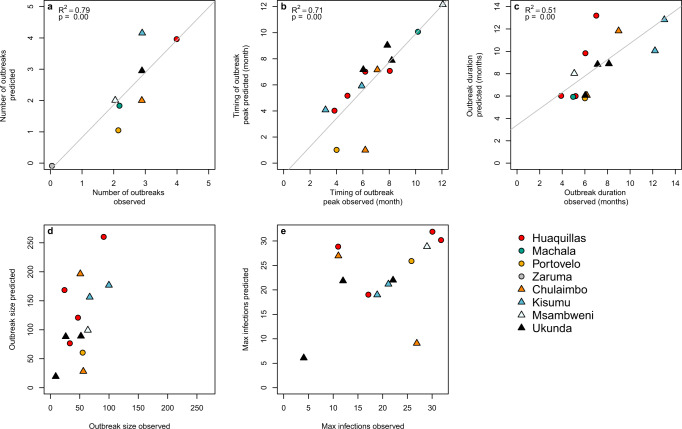
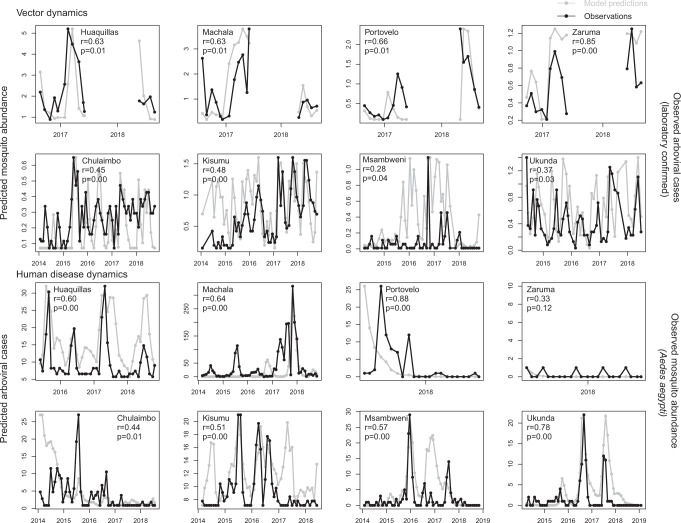
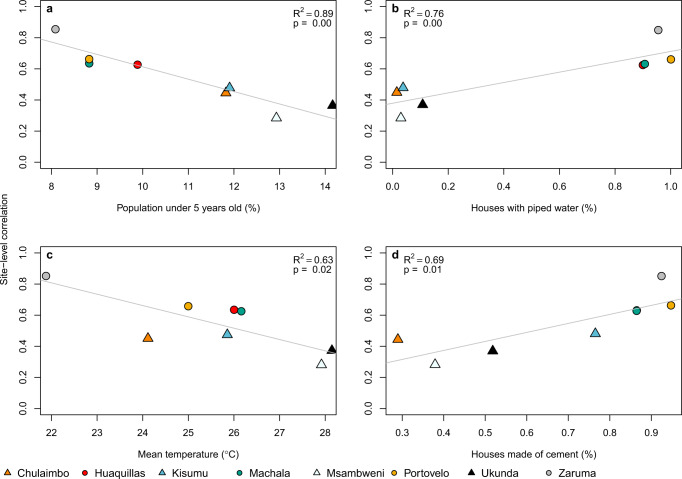
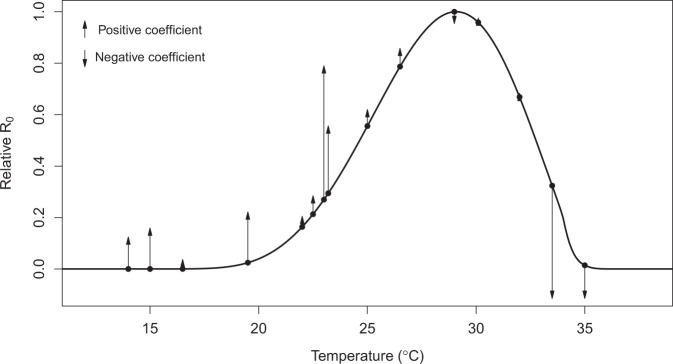
Climate drives population dynamics through multiple mechanisms, which can lead to seemingly context-dependent effects of climate on natural populations. For climate-sensitive diseases, such as dengue, chikungunya, and Zika, climate appears to have opposing effects in different contexts. Here we show that a model, parameterized with laboratory measured climate-driven mosquito physiology, captures three key epidemic characteristics across ecologically and culturally distinct settings in Ecuador and Kenya: the number, timing, and duration of outbreaks. The model generates a range of disease dynamics consistent with observed Aedes aegypti abundances and laboratory-confirmed arboviral incidence with variable accuracy (28-85% for vectors, 44-88% for incidence). The model predicted vector dynamics better in sites with a smaller proportion of young children in the population, lower mean temperature, and homes with piped water and made of cement. Models with limited calibration that robustly capture climate-virus relationships can help guide intervention efforts and climate change disease projections.


Conflict of interest statement

The authors declare no competing interests.

Figures

Fig. 1
Fig. 1. Map of study sites.
a Ecuador in South America and b Kenya in East Africa. We created this map in R using Google Maps as the base layer.
Fig. 2
Fig. 2. SEI-SEIR epidemiological model framework.
The mosquito population is split among susceptible (Sm), exposed (Em), and infectious (Im) compartments (squares), and the human population is split among susceptible (Sh), exposed (Eh), infectious (Ih), and recovered (Rh) compartments. Solid arrows indicate the direction individuals can move between compartments, and dashed arrows indicate the direction of transmission. Transitions among compartments are labeled by the appropriate processes and corresponding rate parameters (see “Methods” for parameter definitions and more detail). Rate parameters with a T, H, and R are temperature-, humidity-, and rainfall-dependent, respectively. The total adult mosquito population (Sm, Em, and Im compartments; dotted rectangle) is maintained at an abundance less than or equal to the mosquito-carrying capacity.
Fig. 3
Fig. 3. Model predictions for the number, timing, and duration of arboviral outbreaks closely matched field observations.
Scatterplots show model predictions versus observations for different epidemic characteristics. a The number of outbreaks indicates the total number of predicted and observed outbreaks in a site over the study period. b Timing of outbreak peak, c outbreak duration, d outbreak size, and e maximum infections (e.g., max Ih during an outbreak) correspond to individual outbreaks where model predictions and observations overlapped in time, therefore, some plots show multiple data points per site. Outbreaks are colored by site with different symbols for Ecuador (circles) and Kenya (triangles). We show regression lines and associated statistics (R2 = coefficient of determination; P value = probability of two-sided hypothesis test) for statistically significant relationships. For visualization purposes, we jittered the data points to show overlapping data, and we excluded data from Machala in plots (d) outbreak size and (e) maximum infections because the magnitude differed substantially from all other sites.
Fig. 4
Fig. 4. Model predicts vector and human disease dynamics better in some settings than others.
Each plot shows the time series of SEI-SEIR model predictions (gray dots connected by gray lines) and field observations (black dots connected by black lines) for vector (top two rows) and human disease (bottom two rows) dynamics for each study site with the pairwise correlation (r) and adjusted P value for two-sided hypothesis test (P). We calculated observed mosquito abundances as the mean number of adult Ae. aegypti per house, month, year, and site. We calculated observed arboviral cases as the total number of laboratory-confirmed dengue (any serotype), chikungunya, and Zika cases per month, year, and site; six of the eight study sites only included dengue cases (see “Methods”). The first and third rows show sites in Ecuador, and the second and fourth rows show sites in Kenya. We show uncertainty in model predictions in Supplementary Figs. 1 and 2.
Fig. 5
Fig. 5. Conceptual model for nonlinear functional relationships between rainfall and vector abundance and arboviral outbreak risk.
Dashed lines show multiple potential pathways for rainfall to affect transmission dynamics and include the functional relationships supported in this study. Labels indicate the hypothesized mechanisms along a gradient of rainfall. Adapted from the following source.
Fig. 6
Fig. 6. Demography, housing construction, and climate affect model predictive capacity for vectors.
Factors that influence the predictability of vector dynamics include (a) proportion of the population under five years of age, (b) proportion of houses with piped water, (c) mean temperature and (d) proportion of houses made with cement (walls and/or floors). Points indicate the pairwise correlation value for a single site (colors) with different symbols for Ecuador (circles) and Kenya (triangles). Each plot also shows the linear regression lines and associated statistics (R2 = coefficient of determination; P value = probability of two-sided hypothesis test).
Fig. 7
Fig. 7. Independently predicted relative R0 from a model derived from laboratory studies explains differences in the magnitude and direction of the effects of temperature on dengue transmission in the field across varied settings from previous studies.
The black line shows the relative basic reproductive number (R0, normalized to a 0–1 scale) plotted against temperature based on all temperature-dependent traits from used in the SEI-SEIR model presented here. Points indicate mean temperature values from previous field-based statistical analyses that related dengue cases with the minimum, maximum, or mean ambient temperature; arrows correspond to the direction (up = positive, down = negative) and relative effect size of the temperature–dengue relationship based on coefficient values from the following studies,,–. See “Methods” and Supplementary Table 1 for more detail. As expected, the largest observed positive effects of temperature occurred in the rapidly increasing portion of the R0 curve (~22–25 °C; consistent with findings in this study) and the largest observed negative effects occurred well above the predicted optimum, near the upper thermal limit (~33–35 °C).

Similar articles

Cited by

References

    1. Ockendon N, et al. Mechanisms underpinning climatic impacts on natural populations: altered species interactions are more important than direct effects. Glob. Chang Biol. 2014;20:2221–2229. doi: 10.1111/gcb.12559. - DOI - PubMed
    1. Boggs CL, Inouye DW. A single climate driver has direct and indirect effects on insect population dynamics. Ecol. Lett. 2012;15:502–508. doi: 10.1111/j.1461-0248.2012.01766.x. - DOI - PubMed
    1. Burkett VR, et al. Nonlinear dynamics in ecosystem response to climatic change: case studies and policy implications. Ecol. Complex. 2005;2:357–394. doi: 10.1016/j.ecocom.2005.04.010. - DOI
    1. Molnár, P. K., Sckrabulis, J. P., Altman, K. A. & Raffel, T. R. Thermal performance curves and the metabolic theory of ecology—a practical guide to models and experiments for parasitologists. J. Parasitol.103, 423–439 (2017). - PubMed
    1. Hortion J, et al. Acute flavivirus and alphavirus infections among children in two different areas of Kenya, 2015. Am. J. Trop. Med. Hyg. 2019;100:170–173. doi: 10.4269/ajtmh.18-0297. - DOI - PMC - PubMed

Publication types