. 2021 Feb 23;12(1):1250.
doi: 10.1038/s41467-021-21381-3.

Whole genome sequencing in the Middle Eastern Qatari population identifies genetic associations with 45 clinically relevant traits

Collaborators, Affiliations

Whole genome sequencing in the Middle Eastern Qatari population identifies genetic associations with 45 clinically relevant traits

Gaurav Thareja et al. Nat Commun. .

Abstract

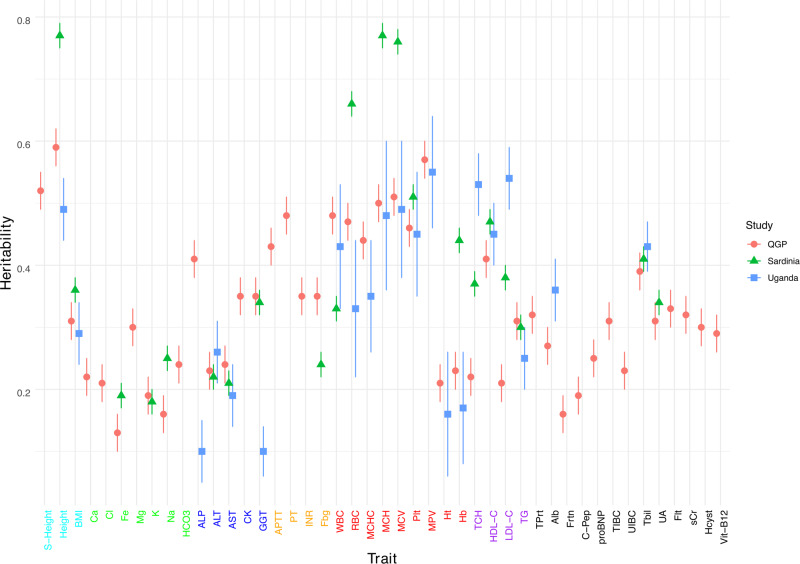
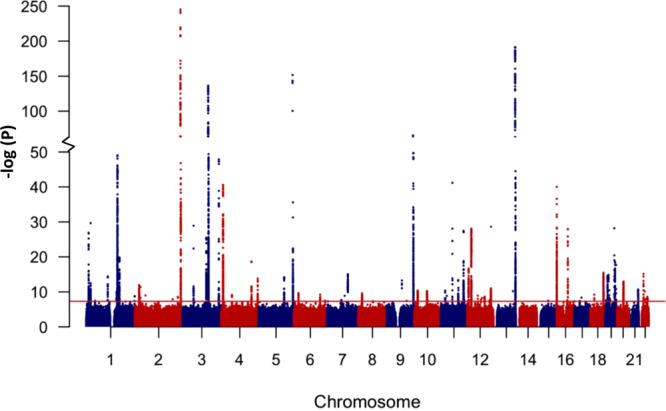
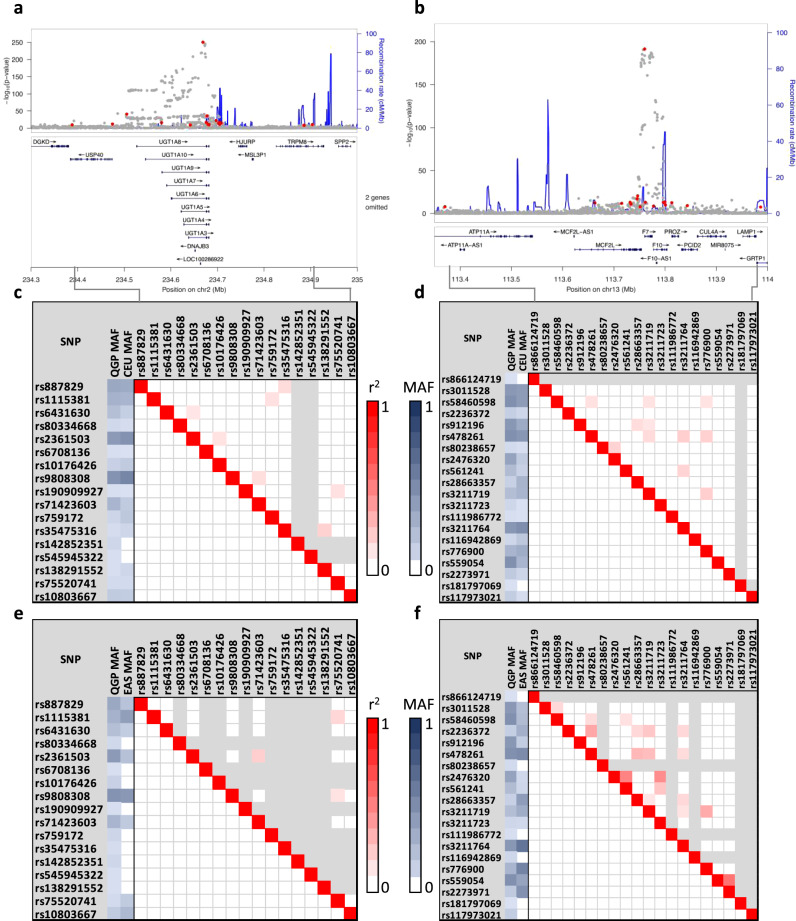
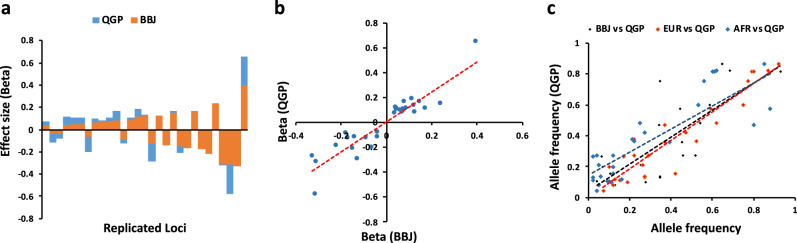
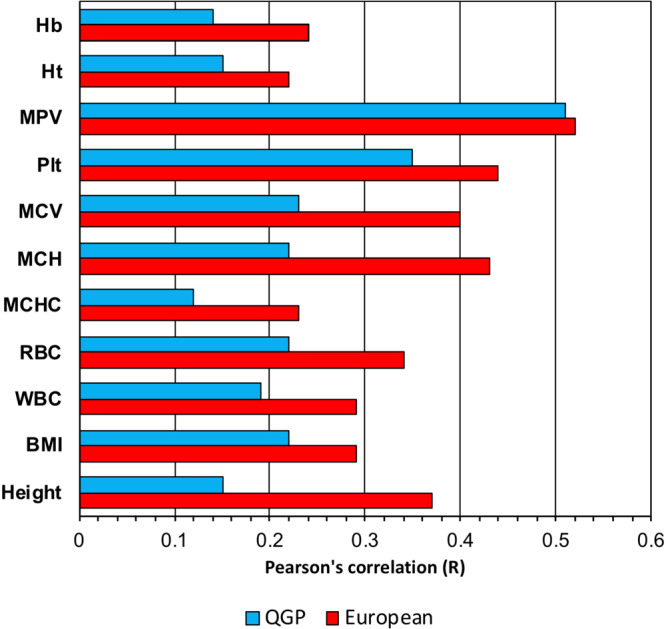
Clinical laboratory tests play a pivotal role in medical decision making, but little is known about their genetic variability between populations. We report a genome-wide association study with 45 clinically relevant traits from the population of Qatar using a whole genome sequencing approach in a discovery set of 6218 individuals and replication in 7768 subjects. Trait heritability is more similar between Qatari and European populations (r = 0.81) than with Africans (r = 0.44). We identify 281 distinct variant-trait-associations at genome wide significance that replicate known associations. Allele frequencies for replicated loci show higher correlations with European (r = 0.94) than with African (r = 0.85) or Japanese (r = 0.80) populations. We find differences in linkage disequilibrium patterns and in effect sizes of the replicated loci compared to previous reports. We also report 17 novel and Qatari-predominate signals providing insights into the biological pathways regulating these traits. We observe that European-derived polygenic scores (PGS) have reduced predictive performance in the Qatari population which could have implications for the translation of PGS between populations and their future application in precision medicine.


Conflict of interest statement

The authors declare no competing interests.

Figures

Fig. 1
Fig. 1. Heritability estimates of 45 clinically-relevant traits.
Heritability estimates of 45 clinically-relevant traits in the Qatar Genome Program cohort (QGP; red markers) compared to estimates from Sardinian (green marker) and Ugandan (blue markers) populations. The heritability estimates in QGP was adjusted for age, gender, the first four population principal components and relatedness. The heritability estimates for several traits in QGP were significantly different from European and African Populations (Supplementary Table 2). Refer to Table 1 for trait abbreviations. Data are presented as mean ± SEM.
Fig. 2
Fig. 2. Manhattan plot of GWAS results from 45 clinically-relevant traits.
The chromosomal position of genetic variants (N = 7,880,618) is plotted against –log10 (P). Analysis was performed using linear mixed models correcting for age, sex, population principal components and relatedness. The red horizontal line represents the threshold for genome-wide significance (P < 5.0 × 10−8).
Fig. 3
Fig. 3. Comparison of allele frequency and linkage disequilibrium patterns.
Example of multiple distinct signals identified at loci associated with clinically-relevant traits. a Regional association plots for total bilirubin (Tbil) locus on chromosome 2 and (b) the prothrombin time (PT) locus on chromosome 13. The plots show chromosomal positions of SNPs plotted against –log10 (P). Multiple distinct signals are shown as red circles, blue lines represent recombination rate. c–f Comparison of allele frequency and linkage disequilibrium for the distinct signals between QGP and European population (c and d) or between QGP and East Asian populations (e and f) for the Tbil and PT loci. Linkage disequilibrium patterns between the distinct signals from QGP data are shown below the red diagonal boxes and those from European (c, d) or East Asian (e, f) populations are shown above the diagonal red boxes. Grayed areas indicate monomorphic SNPs. MAF indicates minor allele frequency from QGP, European (CEU) or East Asian (EAS) populations.
Fig. 4
Fig. 4. Comparison of allele frequency and effect size for known loci.
a The effect size (Beta) for loci showing replication after correction for multiple testing in QGP (blue bars) compared to Biobank Japan project (BBJ, orange bars). b Correlation of effect size for replicated loci between QGP and BBJ. c Correlation of allele frequency for replicated loci between QGP and BBJ (r = 0.80), QGP and European (EUR; r = 0.94), or QGP and African (AFR; r = 0.85) populations. Dotted lines represent lines of best fit from regression analysis.
Fig. 5
Fig. 5. Performance of European-derived polygenic scores in QGP.
Pearson’s correlation (R) between polygenic scores (PGS) and trait values are shown for European populations (red) and Qatari population (blue). Weighted PGS scores were based on those derived from European population.

References

    1. Visscher PM, et al. 10 years of gwas discovery: biology, function, and translation. Am. J. Hum. Genet. 2017;101:5–22. doi: 10.1016/j.ajhg.2017.06.005. - DOI - PMC - PubMed
    1. MacArthur J, et al. The new NHGRI-EBI Catalog of published genome-wide association studies (GWAS Catalog) Nucleic Acids Res. 2017;45:D896–D901. doi: 10.1093/nar/gkw1133. - DOI - PMC - PubMed
    1. Popejoy AB, Fullerton SM. Genomics is failing on diversity. Nature. 2016;538:161–164. doi: 10.1038/538161a. - DOI - PMC - PubMed
    1. Petrovski S, Goldstein DB. Unequal representation of genetic variation across ancestry groups creates healthcare inequality in the application of precision medicine. Genome Biol. 2016;17:157. doi: 10.1186/s13059-016-1016-y. - DOI - PMC - PubMed
    1. Wojcik GL, et al. Genetic analyses of diverse populations improves discovery for complex traits. Nature. 2019;570:514–518. doi: 10.1038/s41586-019-1310-4. - DOI - PMC - PubMed

Publication types

LinkOut - more resources