. 2021 Feb 23;12(1):1237.
doi: 10.1038/s41467-021-21445-4.

Acquired cancer cell resistance to T cell bispecific antibodies and CAR T targeting HER2 through JAK2 down-modulation

Affiliations

Acquired cancer cell resistance to T cell bispecific antibodies and CAR T targeting HER2 through JAK2 down-modulation

Enrique J Arenas et al. Nat Commun. .

Abstract

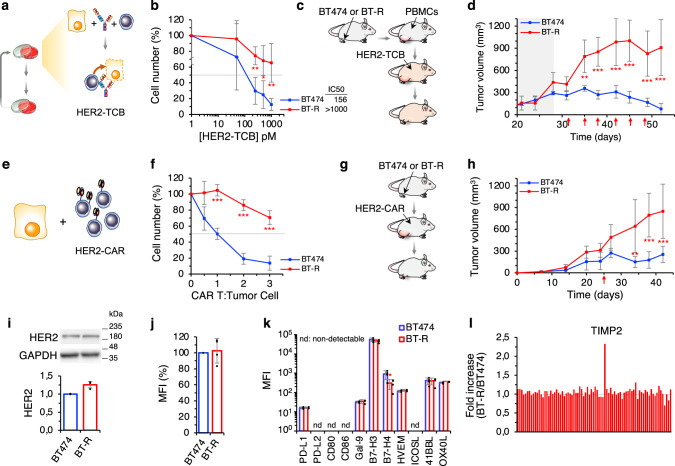
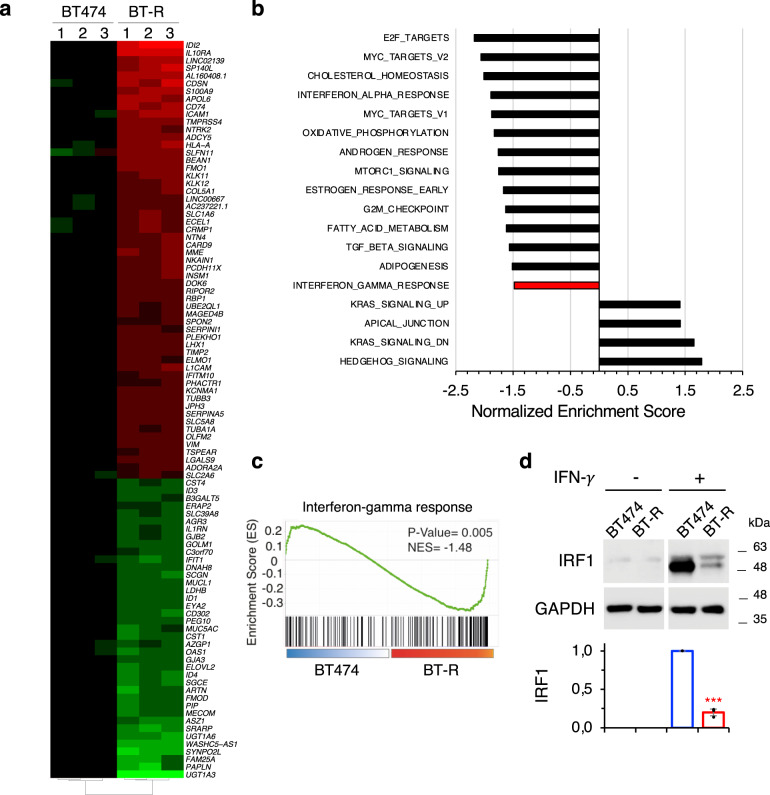
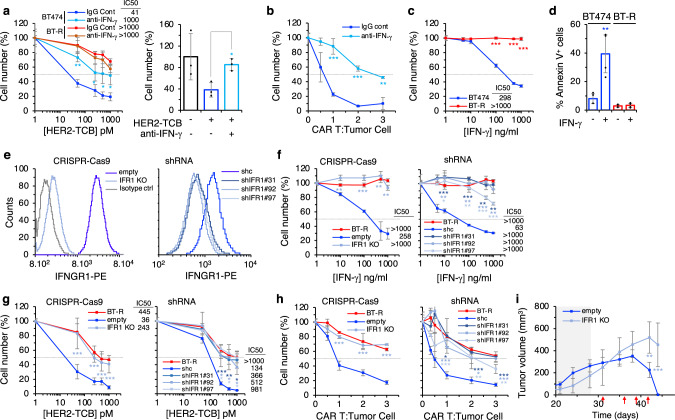
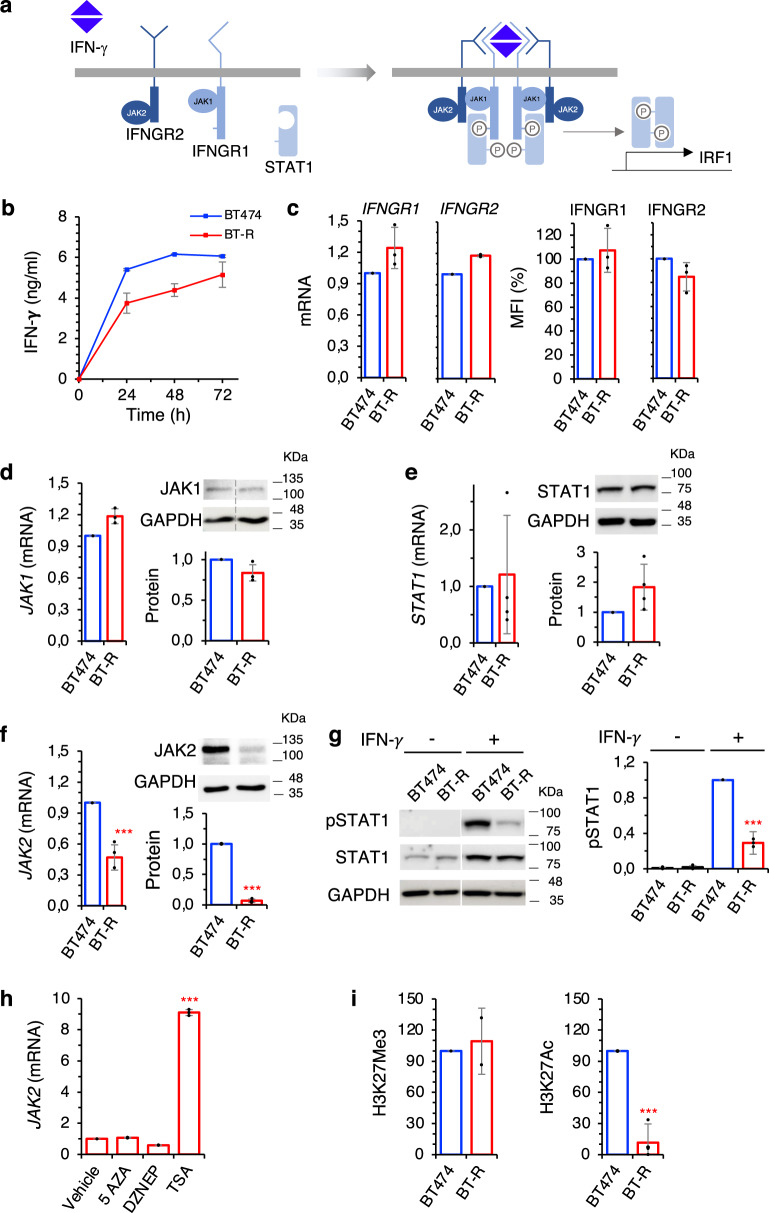
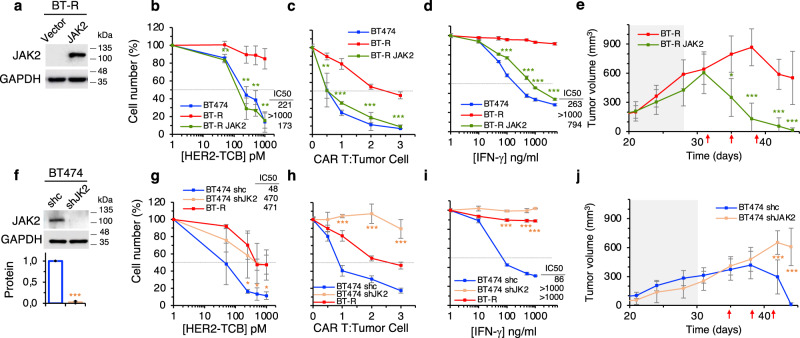
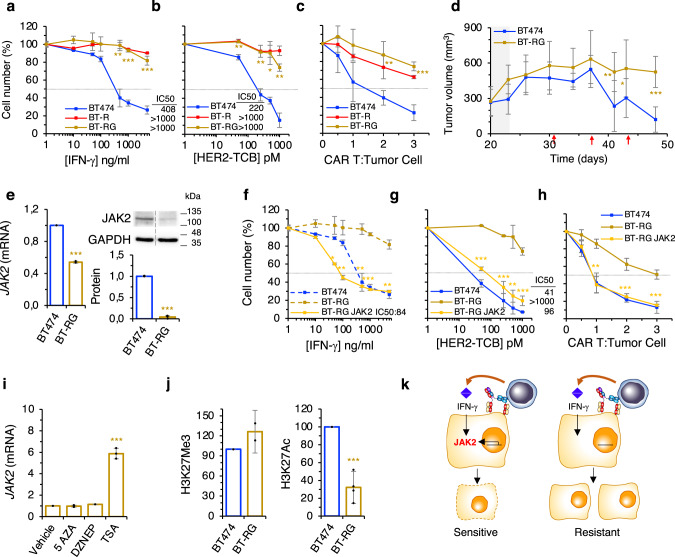
Immunotherapy has raised high expectations in the treatment of virtually every cancer. Many current efforts are focused on ensuring the efficient delivery of active cytotoxic cells to tumors. It is assumed that, once these active cytotoxic cells are correctly engaged to cancer cells, they will unfailingly eliminate the latter, provided that inhibitory factors are in check. T cell bispecific antibodies (TCBs) and chimeric antigen receptors (CARs) offer an opportunity to test this assumption. Using TCB and CARs directed against HER2, here we show that disruption of interferon-gamma signaling confers resistance to killing by active T lymphocytes. The kinase JAK2, which transduces the signal initiated by interferon-gamma, is a component repeatedly disrupted in several independently generated resistant models. Our results unveil a seemingly widespread strategy used by cancer cells to resist clearance by redirected lymphocytes. In addition, they open the possibility that long-term inhibition of interferon-gamma signaling may impair the elimination phase of immunoediting and, thus, promote tumor progression.


Conflict of interest statement

C.K. declares employment, stock ownership, and patents with Roche. A.G. reports receiving funding from Novartis, VCNBiosciences and Merck KGaA, has received speaker honoraria from Roche, and has consulted for Achilles Therapeutics, Neon Therapeutics, Genentech, PACT Pharma and Oxford Immunotherapy. J.A. has received research funds from Roche, Synthon, Menarini, and Molecular Partners and consultancy honoraria from Menarini. The remaining authors declare no competing interests.

Figures

Fig. 1
Fig. 1. Generation and characterization of resistant cells.
a Schematic showing the assay of HER2-TCB in cocultures. b Cocultures of PBMCs with parental BT474 or resistant BT-R cells were treated with different concentrations of HER2-TCB (PBMC:target cell ratio 1:1) for 72 h. Then, viable cells were quantified by flow cytometry using EpCAM as a marker. c Schematic showing in vivo treatment with HER2-TCB. Totally, 107 BT474 or BT-R cells were injected orthotopically into NSG mice. When tumors reached ~200 mm3 (dark background), 107 PBMCs were injected i.p. Then animals were treated i.v. with 0.125 mg/kg HER2-TCB as indicated (red arrows). d Tumor volumes are represented as averages ± SD (standard deviation) (n = 4 per arm). e Schematic showing the HER2-CAR assay. f Parental BT474 cells or resistant BT-R cells were cocultured with different ratios of CAR T cells for 48 h. Cell numbers were calculated and expressed as in (b). g Schematic showing in vivo treatment with HER2-CAR T cells. Mice were injected with BT474 or BT-R cells as in (c). When tumors reached ~200 mm3, 3 × 106 HER2-CAR T-positive cells were injected i.p. h Tumor volumes are represented as averages ± SD (BT474, n = 6; BT-R, n = 8). i Levels of HER2, normalized to BT474 cells, were determined by Western Blot. j Cells were stained with HER2-TCB and analyzed by flow cytometry. Results were normalized to BT474 cells. k Cells were stained with antibodies against the indicated factors. Results are presented as the MFI of staining in BT474 and BT-R cells. l, Levels of 80 cytokines and growth factors were measured using a commercial array in the media conditioned by cocultures of BT474 cells and PBMCs or BT-R cells and PBMCs treated with HER2-TCB. Results are presented as the fold change of BT-R relative to BT474 cells. b **p = 0.005, *p = 0.02, **p = 0.006. f ***p < 0.001. k *p = 0.04, two-tailed t test. d, h **p < 0.01, ***p < 0.001, two-way analysis of variance (ANOVA) and Bonferroni correction. Data are presented as mean ± SD of four (b, f, j, k), or three (i) independent experiments. Source data are provided as a Source Data file.
Fig. 2
Fig. 2. Transcriptomic analysis.
a Heatmap showing the 97 most differentially expressed genes in BT-R cells compared to parental BT474 cells (≥4-fold; p < 10−5). p Value was obtained from the DESeq2 analysis of the RNA-seq. Genes with FDR < 5% and |shrunken fold change| > 1.5 were considered significant. b Pathways showing positive and negative enrichment in BT-R compared with BT474 cells as determined by GSEA. Only statistical gene sets are shown (NOM p value < 0.05). c IFN-γ response GSEA signature in resistant cells, compared to parental BT474. p Value corresponds to the NOM p value obtained by GSEA in the HALLMARK database. d Levels of IRF1 upon treatment with IFN-γ in BT474 and BT-R cells were determined by Western blot analysis. Results of three independent quantifications, normalized to treated BT474 cells, are presented as mean ± SD. ***p < 0.001, two-tailed t test. Source data are provided as a Source Data file.
Fig. 3
Fig. 3. IFN-γ response is required for efficient killing by redirected lymphocytes.
a Left, cocultures of PBMCs with BT474 or BT-R cells were treated with different concentrations of HER2-TCB in presence of an IgG control or an IFN-γ blocking antibody for 72 h. Then, viable cells were quantified by flow cytometry using EpCAM as a marker. Right, BT474 cells were grown in 3D and treated with HER2-TCB in presence of an IgG control (−) or an IFN-γ blocking antibody (+) for 72 h. Viable BT474 cells were quantified by flow cytometry using EpCAM as a marker. Results were normalized to untreated cells. b Parental BT474 cells were cocultured with different ratios of CAR T cells for 48 h in the presence of an IgG control or an IFN-γ blocking antibody. Then, cell numbers were calculated and expressed as in (a). c Parental BT474 or resistant BT-R cells were treated with different concentrations of IFN-γ for 5 days. Cell numbers were estimated with the crystal violet staining assay. d Parental BT474 or resistant BT-R cells were treated with 1 μg/ml of IFN-γ and the percentages of apoptotic cells were determined by means of Annexin V+ cells measured by flow cytometry. e Cells were stained with anti-IFNGR1 or isotype antibody and analyzed by flow cytometry. IFR1 stands for IFNGR1. f Sensitivity of the indicated cells to IFN-γ was analyzed as in (c). g The indicated cells were treated with different concentrations of HER2-TCB and analyzed as in (a). h The indicated cell lines were cocultured with CAR Ts and analyzed as in (b). i Totally, 6.5 × 107 BT474 cells or the same cells knock-out for IFNGR1 were injected orthotopically into NSG mice. Mice were treated as described in Fig. 1c. Tumor volumes are represented as averages ± SD (empty, n = 8; IFR1 KO, n = 4). a Left, **p = 0.001, *p = 0.05; right, *p = 0.01. b ***p < 0.001, **p = 0.002. c ***p < 0.001. d **p = 0.007. f Left, **p = 0.002, ***p < 0.001, **p = 0.003, **p = 0.0013; right, ***p < 0.001, **p = 0.002 (shIFNGR1 #31); **p = 0.009, **p = 0.006, ***p < 0.001, **p = 0.003 (shIFNGR1 #92); *p = 0.02, **p = 0.004, ***p < 0.001 (shIFNGR1 #97). g Left, ***p < 0.001; right, ***p < 0.001, **p = 0.004, *p = 0.02 (shIFNGR1 #31); *p = 0.046, *p = 0.047, *p = 0.03 (shIFNGR1 #92); *p = 0.05, *p = 0.02, *p = 0.02 (shIFNGR1 #97). h Left, ***p < 0.001; right *p = 0.02, ***p < 0.001 (shIFNGR1 #31); ***p < 0.001, *p = 0.02 (shIFNGR1 #92); ***p < 0.001, **p = 0.005, **p = 0.005 (shIFNGR1 #97). Two-tailed t test. i **p < 0.01, ***p < 0.001, two-way ANOVA and Bonferroni correction. Data are presented as mean ± SD of three (ac, f, g right, h), four (d), or six (g left) independent experiments. Source data are provided as a Source Data file.
Fig. 4
Fig. 4. Components of the IFN-γ signaling pathway in resistant cells.
a Schematic showing the IFN-γ signaling pathway. b The levels of IFN-γ in the media conditioned by cocultures with BT474 or resistant BT-R in the presence of HER2-TCB was determined by ELISA. c The levels of Interferon-gamma receptors 1 and 2, normalized to BT474, were determined by quantitative real-time PCR (left) or flow cytometry with specific antibodies (right). df Levels of JAK1, STAT1, and JAK2 (mRNA and protein), normalized to BT474, as determined by quantitative real-time PCR (left) or Western blot (right). g Levels of phosphoSTAT1 in parental and resistant cells were determined by Western Blot. Results were normalized to treated BT474 cells. h BT-R cells were treated with indicated compounds for 48 h. Then, the levels of the mRNA encoding JAK2 were determined by RT-PCR and normalized to the levels in cells treated with vehicle. i Levels of H3K27Me3 and H3K27Ac histone marks in the promoter of JAK2 in BT474 and BT-R cells as measured by ChIP followed by quantitative real-time PCR. Results were normalized to the levels of an IgG control antibody in each sample, and then normalized to the levels in BT474 cells. ***p < 0.001, two-tailed t test. Data are presented as mean ± SD of two (b, i left), three (c, d, h, i right) or four (eg) independent experiments. Source data are provided as a Source Data file.
Fig. 5
Fig. 5. The downmodulation of JAK2 causes resistance to redirected lymphocytes.
a Levels of JAK2 in BT-R cells or the same cells stably transfected with a vector encoding JAK2 were determined by Western blot. Blot shown is representative of four independent experiments. b Cocultures of PBMCs with the indicated cells were treated with different concentrations of HER2-TCB for 72 h. Then, viable target cells were quantified by flow cytometry using EpCAM as a marker. c The indicated cells were treated with different ratios of CAR T cells. Cell numbers were calculated and expressed as in (b). d The indicated cells were treated with different concentrations of IFN-γ for 5 days. Cell numbers were estimated with the crystal violet staining assay. e Totally, 6.5 × 106 BT-R cells or the same cells expressing JAK2 were injected orthotopically into NSG mice. When tumors reached ~200 mm3 (dark background), 107 PBMCs were injected i.p. Then animals were treated i.v. with 0.125 mg/kg HER2-TCB as indicated (red arrows). Tumor volumes are represented as averages ± SD (n = 7 per arm). f Levels of JAK2 in BT474 cells stably expressing a non-targeting shRNA (shc) or an shRNA targeting JAK2 (shJK2) were determined by Western blot. Results were normalized to BT474 shc. gi The indicated cells were analyzed as in (bd), respectively. j Totally, 6.5 × 106 BT474 cells stably expressing a non-targeting shRNA (shc) or an shRNA targeting JAK2 (shJAK2) were injected into NSG mice and treated as in (e). Tumor volumes are represented as averages ± SD (shc, n = 10; shJAK2, n = 5). b **p = 0.005, **p = 0.003, **p = 0.002, **p = 0.002. c **p = 0.002, ***p < 0.001. d ***p < 0.001. g *p = 0.05, *p = 0.05, *p = 0.02. h, i ***p < 0.001, two-tailed t test. e, j *p < 0.05, ***p < 0.001, two-way ANOVA and Bonferroni correction. Data are presented as mean ± SD of three (bd, h, i) or four (f, g) independent experiments. Source data are provided as a Source Data file.
Fig. 6
Fig. 6. Model of resistance to IFN-γ.
a Parental BT474 cells or resistant BT-R or BT-RG cells were treated with different concentrations of IFN-γ for 5 days. Cell numbers were estimated with the crystal violet staining assay. b Cocultures of PBMCs with the indicated cells were treated with different concentrations of HER2-TCB for 72 h. Then, viable target cells were quantified by flow cytometry using EpCAM as a marker. c The same cells as in (a) were treated with different ratios of CAR T:Tumor cell. Cell numbers were obtained by means of EpCAM counts by flow cytometry. d Totally, 107 BT474 or resistant BT-RG cells were injected orthotopically into NSG mice. When tumors reached ~300 mm3 (dark background), 107 PBMCs were injected i.p. Then animals were treated i.v. with 0.125 mg/kg HER2-TCB as indicated (red arrows). Tumor volumes are represented as averages ± SD (BT474, n = 8; BT-RG, n = 6). e The levels of JAK2 (mRNA and protein) as determined by quantitative real-time PCR (left) or Western blot (right). Results were normalized to BT474 cells. fh The indicated cells were analyzed as in (ac), respectively. i BT-RG cells were treated with indicated compounds for 48 h. Then, the levels of the mRNA encoding JAK2 were determined by RT-PCR and normalized to the levels in cells treated with vehicle. j Levels of H3K27Me3 and H3K27Ac histone marks in the promoter of JAK2 in BT474 and BT-RG cells as measured by ChIP followed by quantitative real-time PCR. Results were normalized to the levels of an IgG control antibody in each sample, and then normalized to the levels in BT474 cells. k Schematic drawing summarizing our findings. a **p = 0.002, ***p < 0.001. b **p = 0.009, **p = 0.006, *p = 0.013, **p = 0.002. c **p = 0.008, ***p < 0.001. e ***p < 0.001. f *p = 0.02, **p = 0.004, **p = 0.002, ***p < 0.001, **p = 0.002. g **p = 0.005, ***p < 0.001. h **p = 0.0015, ***p < 0.001. i, j ***p < 0.001. Two-tailed t test. d *p < 0.05, **p < 0.01, ***p < 0.001, two-way ANOVA and Bonferroni correction. Data are presented as mean ± SD of three (ac, ei), two (j left) or four (j right) independent experiments. Source data are provided as a Source Data file.

References

    1. Goebeler M-E, Bargou RC. T cell-engaging therapies—BiTEs and beyond. Nat. Rev. Clin. Oncol. 2020;16:2825–434. - PubMed
    1. Singh AK, McGuirk JP. CAR T cells: continuation in a revolution of immunotherapy. Lancet Oncol. 2020;21:e168–e178. doi: 10.1016/S1470-2045(19)30823-X. - DOI - PubMed
    1. Rader C. Bispecific antibodies in cancer immunotherapy. Curr. Opin. Biotechnol. 2019;65:9–16. doi: 10.1016/j.copbio.2019.11.020. - DOI - PMC - PubMed
    1. Strohl, Naso. Bispecific T-cell redirection versus chimeric antigen receptor (CAR)-T cells as approaches to kill cancer cells. Antibodies. 2019;8:41–68. doi: 10.3390/antib8030041. - DOI - PMC - PubMed
    1. Labrijn AF, Janmaat ML, Reichert JM, Parren PWHI. Bispecific antibodies: a mechanistic review of the pipeline. Nat. Rev. Drug Discov. 2019;18:585–608. doi: 10.1038/s41573-019-0028-1. - DOI - PubMed

Publication types