. 2021 Feb 23;12(1):1240.
doi: 10.1038/s41467-021-21509-5.

Local computational methods to improve the interpretability and analysis of cryo-EM maps

Affiliations

Local computational methods to improve the interpretability and analysis of cryo-EM maps

Satinder Kaur et al. Nat Commun. .

Abstract

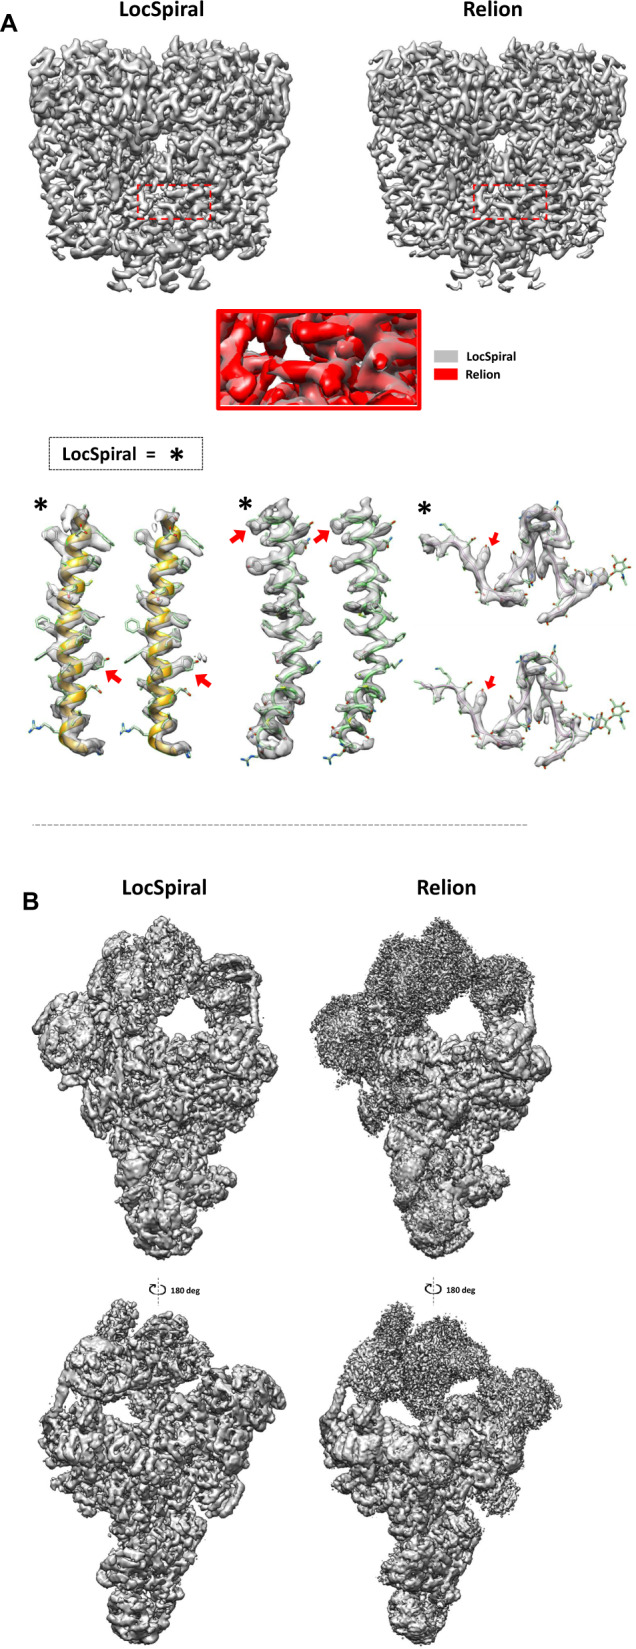
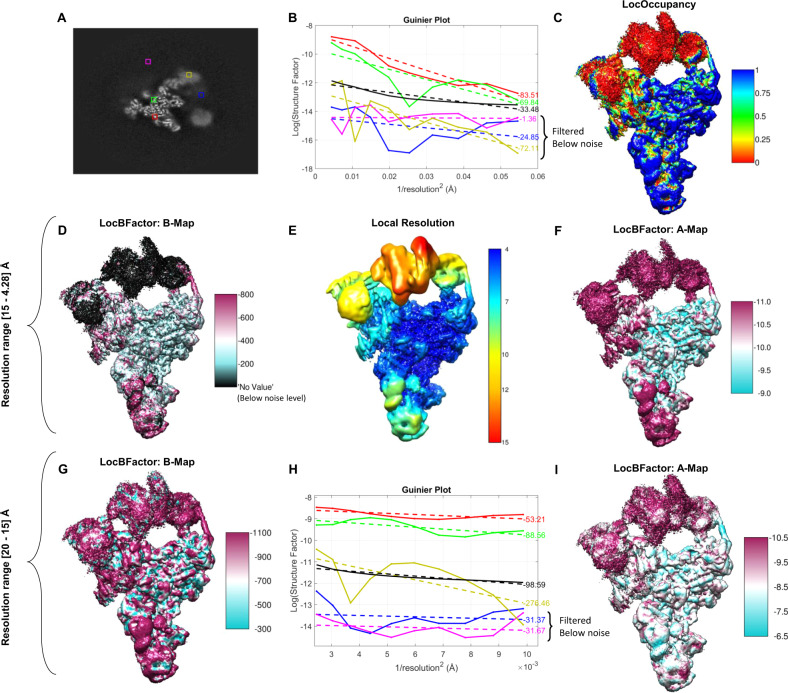
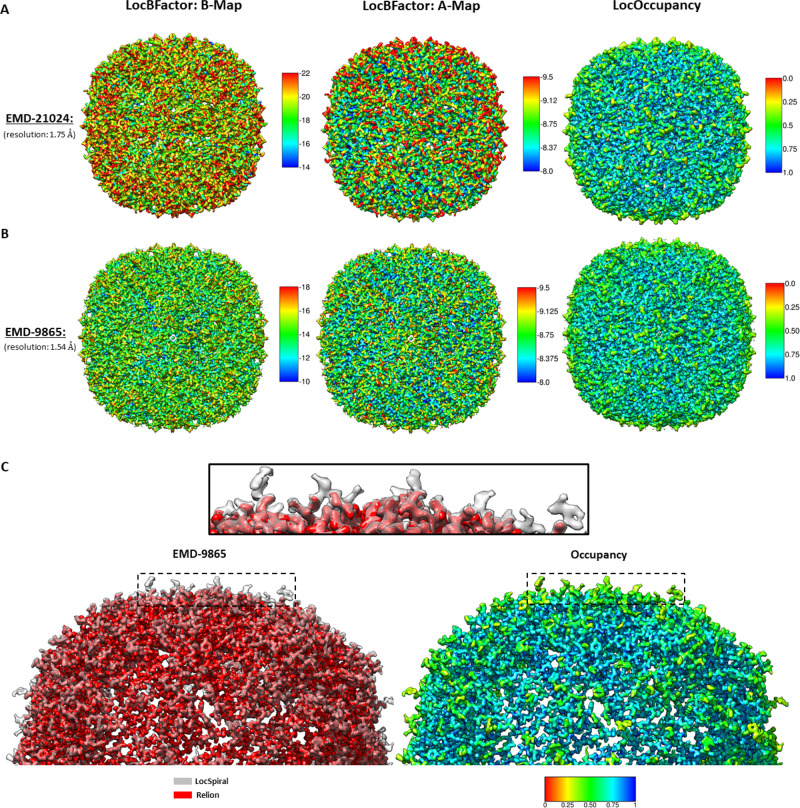
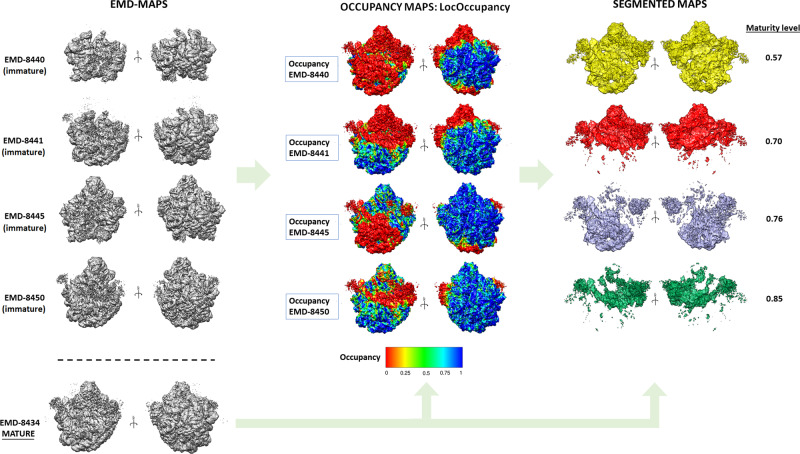
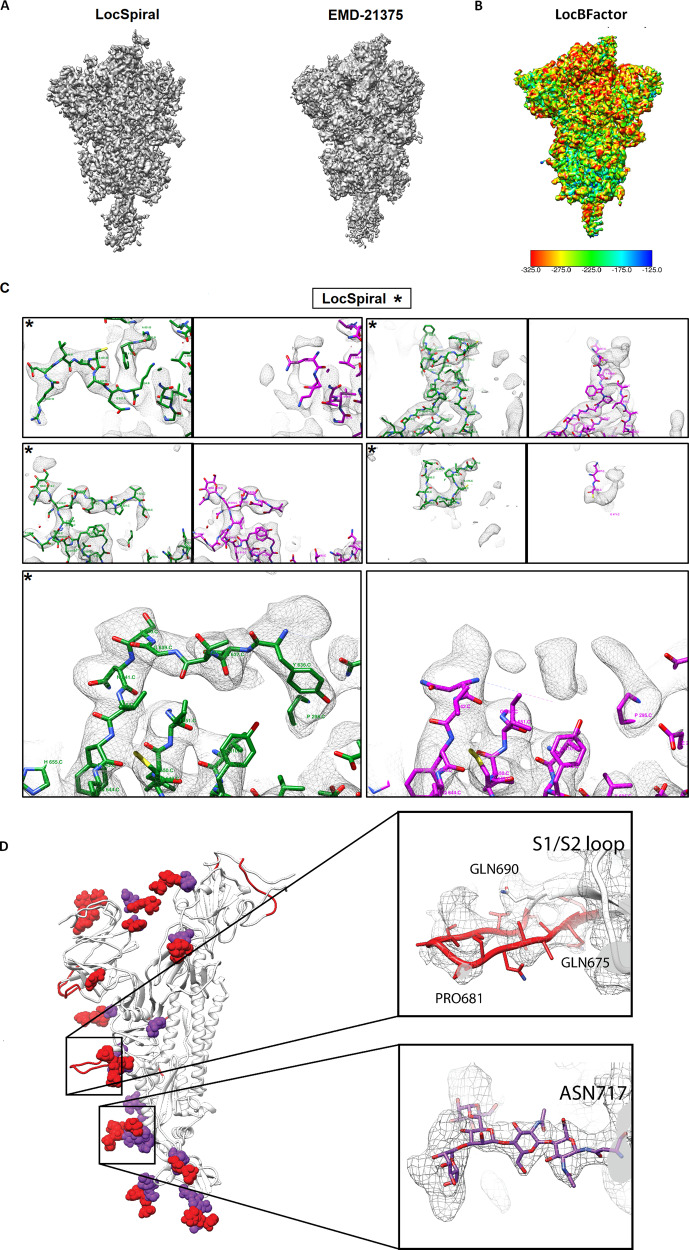
Cryo-electron microscopy (cryo-EM) maps usually show heterogeneous distributions of B-factors and electron density occupancies and are typically B-factor sharpened to improve their contrast and interpretability at high-resolutions. However, 'over-sharpening' due to the application of a single global B-factor can distort processed maps causing connected densities to appear broken and disconnected. This issue limits the interpretability of cryo-EM maps, i.e. ab initio modelling. In this work, we propose 1) approaches to enhance high-resolution features of cryo-EM maps, while preventing map distortions and 2) methods to obtain local B-factors and electron density occupancy maps. These algorithms have as common link the use of the spiral phase transformation and are called LocSpiral, LocBSharpen, LocBFactor and LocOccupancy. Our results, which include improved maps of recent SARS-CoV-2 structures, show that our methods can improve the interpretability and analysis of obtained reconstructions.


Conflict of interest statement

The authors declare no competing interests.

Figures

Fig. 1
Fig. 1. Capacity of LocSpiral to improve the interpretability of cryo-EM maps.
A Top: sharpened maps of the TRP channel obtained by LocSpiral (left) and Relion postprocessing (right) methods. The threshold values are adjusted to provide similar densities in the core inner part of the protein. The red square in the figure shows a zoomed view of the protein inner core where both maps (LocSpiral and Relion) are superimposed. Relion map appears in red colour, while LocSpiral is in grey. Bottom: Fitted map densities (LocSpiral and Relion) with the corresponding atomic model (PDB ID: 6t9n) of two α-helices and one loop. The asterisks mark results obtained by LocSpiral approach. The residues marked with a red arrow were used to adjust the threshold values between maps. B Spliceosome maps at different orientations and similar threshold values obtained by LocSpiral and the postprocessing method of Relion.
Fig. 2
Fig. 2. Results obtained by LocBFactor and LocOccupancy for the Saccharomyces cerevisiae pre-catalytic B complex spliceosome sample.
A Central slice along Z axis of the obtained unsharpened map using EMPIAR 10180 single particles. Coloured squares mark parts of the map corresponding to clear spliceosome densities (green and red), flexible and low-resolution spliceosomal regions (yellow and blue) and background (magenta). B Guinier plots at map points indicated in the coloured squares using a resolution range of [15–4.28] Å. Solid lines represent SNR-weighted values of the logarithm of structure factor amplitudes, while discontinued lines show the fitted lines. C Spliceosome map coloured with the obtained occupancy map by LocOccupancy. The occupancy ranges from 0 (red colour) to 1 (blue colour), indicating no macromolecular density and full occupancy, respectively. D Spliceosome map coloured with the B-factor map to be used for sharpening (slope of the local Guinier plot multiplied by 4) obtained by LocBFactor using a resolution range of [15–4.28] Å. The local B-factor values in the figure range approximately between −800 and −200 Å2. In this figure, noise B-factors (B-factors obtained from amplitudes below the noise level for the used resolution range) are filtered out and appear with black colour. E Local resolution map obtained by Resmap approach. The local resolution ranges between 4 (blue colour) and 15 Å (red colour). F Spliceosome map coloured with the obtained A map (local values of the logarithm of structure factor amplitudes at 15 Å). The values range between −11.0 (magenta colour) and −9.0 (cyan colour) approximately. G Spliceosome map coloured with the B-factor map (B-map) obtained by LocBFactor using a resolution range of [20–15] Å. The B-factor values range between −1100 (magenta colour) and −300 (cyan colour) approximately. H Guinier plots at map points indicated in the coloured squares using a resolution range of [20–15] Å. Solid lines represent SNR-weighted values of the logarithm of structure factor amplitudes, while discontinued lines show the fitted lines. I Spliceosome map coloured with the obtained A map (local values of the logarithm of structure factor amplitudes at 20 Å). The values range between −10.5 (magenta colour) and −6.5 (cyan colour) approximately.
Fig. 3
Fig. 3. Results obtained by LocBFactor, LocOccupancy and LocSpiral for apoferritin sample.
Obtained B-maps (local B-factor map corresponding to the slope of the local Guinier plots), A-maps (local values of the logarithm of structure factor amplitudes at 15 Å) and occupancy maps by LocBFactor and LocOccupancy for EMD-21024 (A) and EMD-9865 (B). The B-factor ranges between [−22, −14] Å2 in A and [−18, −10] Å2 in B. The A-map ranges between [−9.5, −8.0] in A and B. The occupancy ranges between [0, 1] in A and B. In C, we show on the left side, superimposed sharpened maps obtained by LocSpiral (grey colour) and Relion (red colour) for EMD-9865. The black rectangle shows a zoomed view of the region indicated with the dashed rectangles. On the right, we show the respective occupancy map obtained by LocOccupancy at the same orientation that these sharpened maps. In this figure, 0 (red colour) indicates no density occupancy and 1 (blue colour) full occupancy.
Fig. 4
Fig. 4. Results obtained by LocOccupancy for immature 50S ribosomes.
First column: immature maps at different orientations as deposited in EMDB. Second column: obtained occupancy maps by LocOccupancy, where the mature 50S ribosome (EMDB-8434) is coloured with corresponding occupancy maps obtained from the immature ribosomes. The occupancy ranges between [0, 1]. Third column: Segmented maps showing the densities that are missing in the different immature maps when compared to the mature 50S reconstruction and obtained maturity levels. The different colours (yellow, red, purple, green) label the different corresponding segmented regions for each case.
Fig. 5
Fig. 5. Results obtained by LocSpiral, LocBFactor and improved atomic model for EMD-21375 SARS-CoV-2 sample.
A Map obtained by LocSpiral approach (left) compared with the map as deposited in EMDB for EMD-21375. B B-factor maps to be used for sharpening (slope of the local Guinier plot multiplied by 4) obtained by LocBFactor approach for EMD-21375. The B-factor ranges between [−325.0, −125.0] Å2. C Visual examples of map regions corresponding to EMD-21375 that could be further modelled after processing the corresponding unfiltered and unsharpened map with LocSpiral approach. On the left and marked with asterisks, we show the LocSpiral maps with the improved atomic models in green, and on the right the deposited EMD-21375 map with the PDB 6vsb in magenta. D In white, PDB 6vsb with traced parts of the glycan proteins marked with purple spheres. In red, additional parts that could be traced using LocSpiral map. Inside the black squares, zoomed views of two glycan proteins that could be further modelled.

References

    1. Wandzik, J. M. et al. A structure-based model for the complete transcription cycle of influenza polymerase. Cell10.1016/j.cell.2020.03.061 (2020). - PubMed
    1. Ge, P. et al. Action of a minimal contractile bactericidal nanomachine. Nature10.1038/s41586-020-2186-z (2020). - PMC - PubMed
    1. Davis JH, et al. Modular assembly of the bacterial large ribosomal subunit. Cell. 2016;167:1610–1622 e1615. doi: 10.1016/j.cell.2016.11.020. - DOI - PMC - PubMed
    1. Plaschka C, Lin PC, Nagai K. Structure of a pre-catalytic spliceosome. Nature. 2017;546:617–621. doi: 10.1038/nature22799. - DOI - PMC - PubMed
    1. Razi, A. et al. Role of Era in assembly and homeostasis of the ribosomal small subunit. Nucleic Acids Res.10.1093/nar/gkz571 (2019). - PMC - PubMed

Publication types

LinkOut - more resources