. 2021 Feb 23;7(1):12.
doi: 10.1038/s41540-020-00167-1.

Automating parameter selection to avoid implausible biological pathway models

Affiliations

Automating parameter selection to avoid implausible biological pathway models

Chris S Magnano et al. NPJ Syst Biol Appl. .

Abstract

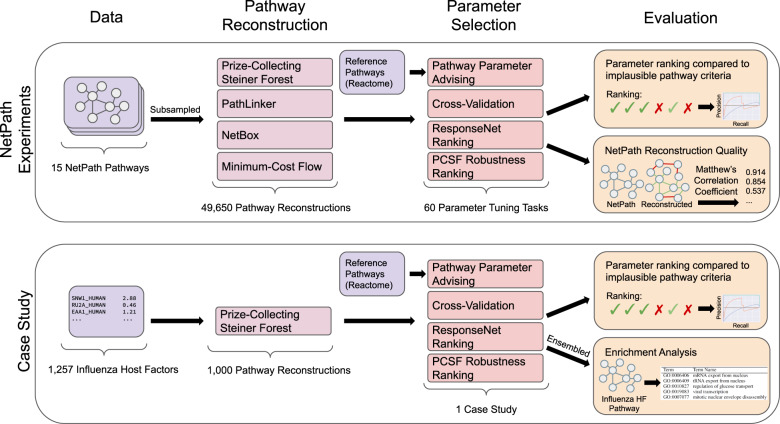
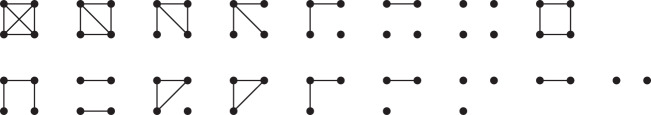
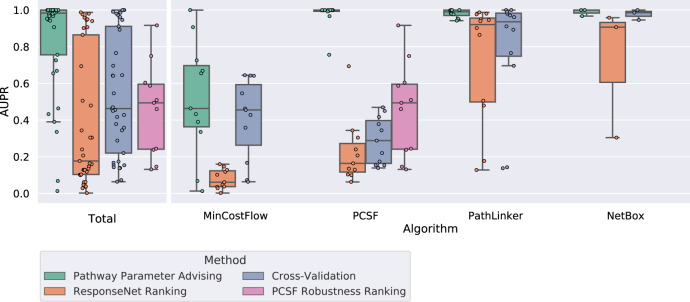
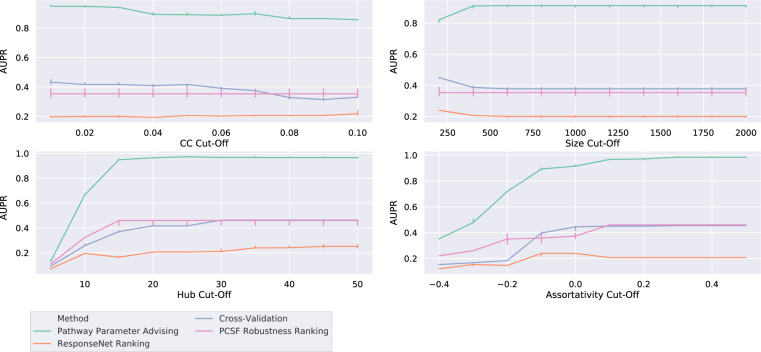
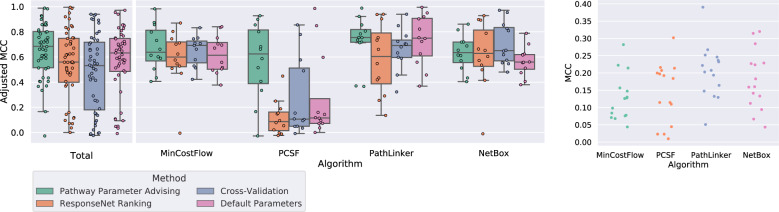
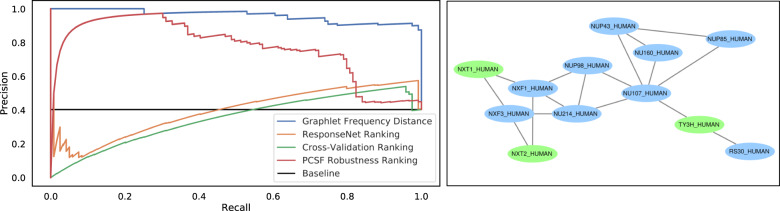
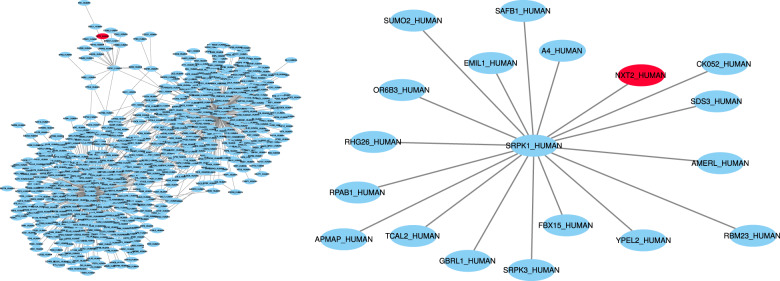
A common way to integrate and analyze large amounts of biological "omic" data is through pathway reconstruction: using condition-specific omic data to create a subnetwork of a generic background network that represents some process or cellular state. A challenge in pathway reconstruction is that adjusting pathway reconstruction algorithms' parameters produces pathways with drastically different topological properties and biological interpretations. Due to the exploratory nature of pathway reconstruction, there is no ground truth for direct evaluation, so parameter tuning methods typically used in statistics and machine learning are inapplicable. We developed the pathway parameter advising algorithm to tune pathway reconstruction algorithms to minimize biologically implausible predictions. We leverage background knowledge in pathway databases to select pathways whose high-level structure resembles that of manually curated biological pathways. At the core of this method is a graphlet decomposition metric, which measures topological similarity to curated biological pathways. In order to evaluate pathway parameter advising, we compare its performance in avoiding implausible networks and reconstructing pathways from the NetPath database with other parameter selection methods across four pathway reconstruction algorithms. We also demonstrate how pathway parameter advising can guide reconstruction of an influenza host factor network. Pathway parameter advising is method agnostic; it is applicable to any pathway reconstruction algorithm with tunable parameters.


Conflict of interest statement

The authors declare no competing interests.

Figures

Fig. 1
Fig. 1. Influenza host factor pathways created using PCSF from RNA interference (RNAi) screens (see “Influenza host factor pathway reconstruction”), here showing the largest connected components from ensembling the bottom 100 ranked pathways (left) and the top 100 ranked pathways (right).
The only difference in creating the networks was the range of PCSF parameter values.
Fig. 2
Fig. 2. Summary of experiments.
An overview of the experiments performed to evaluate pathway parameter advising.
Fig. 3
Fig. 3. All graphlets of size 2, 3, and 4.
Pathways are decomposed into these 17 graphlets for graphlet frequency distance calculations.
Fig. 4
Fig. 4. Performance of parameter selection methods on avoiding implausible networks.
Boxplots represent the distributions of the AUPRs aggregated for 4 pathway reconstruction methods and 12 NetPath test pathways. Boxplots are filled in from the first to third quartiles with a line at the median and whiskers representing 1.5 times the interquartile range. Degenerate cases where all or no pathways met the plausibility criteria are excluded. Full results, including the three validation pathways and degenerate cases, can be found in Supplementary Figs. 2–5.
Fig. 5
Fig. 5. Performance of parameter selection methods on avoiding implausible networks as the threshold for plausibility is varied across different topological features—clustering coefficient, pathway size, hub node dependence, and assortativity—as described in section “Evaluating reconstructed pathway plausibility”.
Lines show median AUPR over the varied thresholds for the other three topological features for all 12 NetPath test pathways and 4 pathway reconstruction methods. Error bars show the 95% confidence interval.
Fig. 6
Fig. 6. Performance of parameter selection methods on pathway reconstruction tasks.
Left: adjusted MCC of parameter selection methods on reconstructing 12 NetPath test pathways across 4 pathway reconstruction methods. MCCs were adjusted by normalizing them to the highest possible MCC within a given pathway reconstruction method and pathway. Boxplots are filled in from the first to third quartiles with a line at the median and whiskers representing 1.5 times the interquartile range. Supplementary Fig. 6 shows MCC values by pathway. Right: the highest possible MCC of pathway reconstruction in 60 parameter sweeps across 4 pathway reconstruction methods and 15 NetPath pathways (validation and test). The MCC values are generally low, reflecting low overlap between the predicted and NetPath pathway edges.
Fig. 7
Fig. 7. Ranking influenza host factor pathway reconstructions.
Left: precision–recall curves for implausible networks in PCSF influenza host factor network construction. Right: a component of the influenza host factor ensemble pathway created from the top 50 PCSF parameter settings ranked by pathway parameter advising. This component represents 12 of the 86 total nodes in the pathway (Supplementary Fig. 7). Host factor nodes provided as input are shown in blue, while green nodes are “Steiner” nodes that PCSF predicts to connect the host factors.
Fig. 8
Fig. 8. All nodes within distance 3 (left) and distance 2 (right) of NXT2, which is highlighted in orange, in the PCSF influenza host factor pathway reconstructed from default parameters.
The default parameters resulted in a large hub node focused pathway with little useful biological insight.
Fig. 9
Fig. 9. Distribution of aggregated graphlet-based distances (E(G)) for reconstructed pathways, Reactome pathways, and Reactome pathways with added noise.
These aggregate distances were the metric used by pathway parameter advising to rank pathways, with lower distances being ranked higher. They were calculated by comparing the candidate pathway (reconstructed pathway, Reactome pathway, or noisy Reactome pathway) with all of the reference Reactome pathways. Distributions for pathway reconstruction methods are made up of all reconstructions performed across all parameter settings tested on the 15 NetPath pathways. However, Reactome pathways were excluded from their own distance calculation. Vertical dashed lines show the mean graphlet distance.

References

    1. Goh WWB, Lee YH, Chung M, Wong L. How advancement in biological network analysis methods empowers proteomics. Proteomics. 2012;12:550–563. doi: 10.1002/pmic.201100321. - DOI - PubMed
    1. Furlong LI. Human diseases through the lens of network biology. Trends Genet. 2013;29:150–159. doi: 10.1016/j.tig.2012.11.004. - DOI - PubMed
    1. Köksal AS, et al. Synthesizing signaling pathways from temporal phosphoproteomic data. Cell Rep. 2018;24:3607–3618. doi: 10.1016/j.celrep.2018.08.085. - DOI - PMC - PubMed
    1. Choobdar S, et al. Assessment of network module identification across complex diseases. Nat. Methods. 2019;16:843–852. doi: 10.1038/s41592-019-0509-5. - DOI - PMC - PubMed
    1. Cowen L, Ideker T, Raphael BJ, Sharan R. Network propagation: a universal amplifier of genetic associations. Nat. Rev. Genet. 2017;18:551–562. doi: 10.1038/nrg.2017.38. - DOI - PubMed

Publication types

LinkOut - more resources