. 2021 Feb 23;12(1):1235.
doi: 10.1038/s41467-021-21498-5.

Global irrigation contribution to wheat and maize yield

Affiliations

Global irrigation contribution to wheat and maize yield

Xuhui Wang et al. Nat Commun. .

Abstract

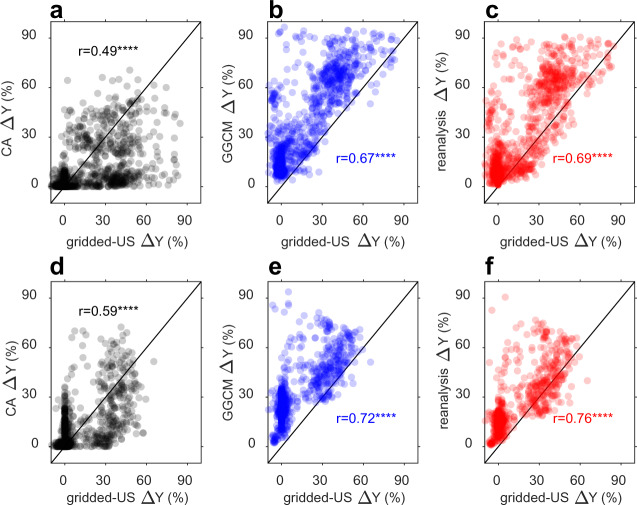
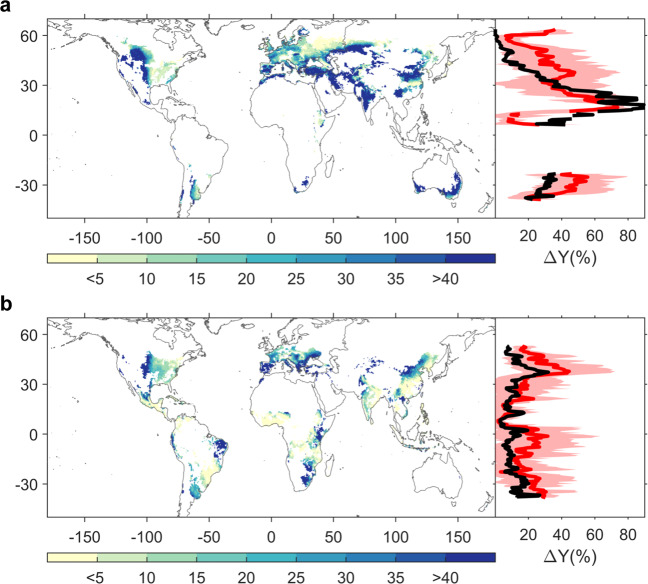
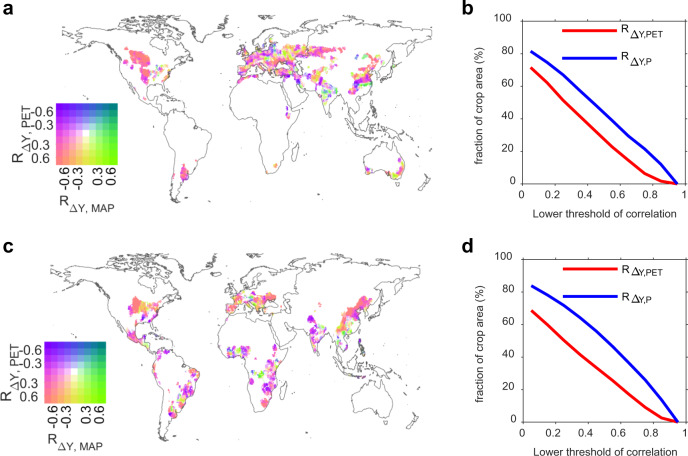
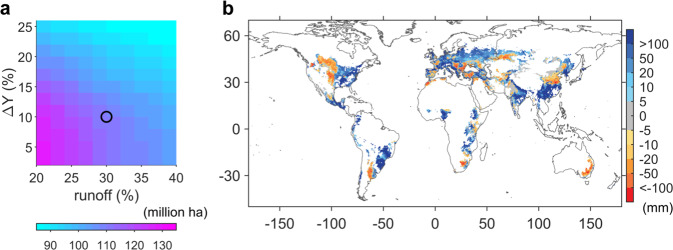
Irrigation is the largest sector of human water use and an important option for increasing crop production and reducing drought impacts. However, the potential for irrigation to contribute to global crop yields remains uncertain. Here, we quantify this contribution for wheat and maize at global scale by developing a Bayesian framework integrating empirical estimates and gridded global crop models on new maps of the relative difference between attainable rainfed and irrigated yield (ΔY). At global scale, ΔY is 34 ± 9% for wheat and 22 ± 13% for maize, with large spatial differences driven more by patterns of precipitation than that of evaporative demand. Comparing irrigation demands with renewable water supply, we find 30-47% of contemporary rainfed agriculture of wheat and maize cannot achieve yield gap closure utilizing current river discharge, unless more water diversion projects are set in place, putting into question the potential of irrigation to mitigate climate change impacts.


Conflict of interest statement

The authors declare no competing interests.

Figures

Fig. 1
Fig. 1. Comparison of irrigation contribution to yield (ΔY) estimated from statistics over conterminous United States (gridded-US) and from different approaches, for wheat (top panels) and for maize (bottom panels).
a, d ΔY estimated from the climate analogue (CA) approach; b, e ΔY estimated from global gridded crop models (GGCM); c, f ΔY estimated from Bayesian model average (BMA). Details of different datasets and approaches can be found in the Methods section. r indicates Pearson correlation coefficient between ΔY estimated from gridded-US and other ΔY estimates. **** indicates significant (p < 0.01) Pearson correlation (two-tailed tests, no adjustments).
Fig. 2
Fig. 2. Spatial and latitudinal changes in ΔY over contemporary growing area for wheat and maize.
a Wheat, b maize. The left panel represents spatial distribution of reanalyzed ΔY. The right panel shows latitudinal distribution of ΔY for each one degree latitudinal band. The black curve shows ΔY estimated from the climate analog (CA) and the red curve shows ΔY estimated from the reanalysis, with shaded area indicates the range of uncertainty (1σ standard deviation across models).
Fig. 3
Fig. 3. Partial correlation in the spatial domain between reanalyzed ΔY and climatic variables (potential evapotranspiration (PET) and mean annual precipitation (MAP)) for wheat (top panels) and for maize (bottom panels).
a, c Bivariate mapping for spatial distribution of the partial correlation coefficient between ΔY and PET (RΔY,PET) and that between ΔY and MAP (RΔY,MAP). b, d Percentage of cropland area where ΔY is controlled by PET or precipitation depending on the chosen threshold (x-axis) for the partial correlation coefficients.
Fig. 4
Fig. 4. Relationship between irrigation demand estimated from the reanalysis for contemporary rainfed croplands of wheat and maize and available runoff resources.
a The amount of rainfed crop area when irrigation demand cannot be met with available runoff resources, according to different minimum threshold of ΔY (y-axis) and maximum threshold of runoff consumption (x-axis). b The spatial distribution of the difference between irrigation demand and available runoff resources. The spatial pattern is determined with the minimum threshold of ΔY for demanding irrigation is 10% and the maximum usage of runoff is 30% (corresponding to the black circle in a). See Supplementary Fig. 5 for spatial pattern of different thresholds of maximum runoff usage.

References

    1. Tilman D, Balzer C, Hill J, Befort BL. Global food demand and the sustainable intensification of agriculture. Proc. Natl Acad. Sci. USA. 2011;108:20260–20264. doi: 10.1073/pnas.1116437108. - DOI - PMC - PubMed
    1. Alexandratos, N. & Bruinsma, J. World Agriculture Towards 2030/2050: The 2012 Revision (FAO, ESA Working paper, Rome, 2012).
    1. Carlson KM, et al. Greenhouse gas emissions intensity of global croplands. Nat. Clim. Change. 2017;7:63–68. doi: 10.1038/nclimate3158. - DOI
    1. Houghton RA, et al. Carbon emissions from land use and land-cover change. Biogeosciences. 2012;9:5125–5142. doi: 10.5194/bg-9-5125-2012. - DOI
    1. Cassman KG, Dobermann A, Walters DT, Yang H. Meeting cereal demand while protecting natural resources and improving environmental quality. Annu. Rev. Environ. Resour. 2003;28:315–358. doi: 10.1146/annurev.energy.28.040202.122858. - DOI

Publication types

LinkOut - more resources