. 2021 Feb 23;12(1):1081.
doi: 10.1038/s41467-021-21399-7.

Emergent vulnerability to climate-driven disturbances in European forests

Affiliations

Emergent vulnerability to climate-driven disturbances in European forests

Giovanni Forzieri et al. Nat Commun. .

Abstract

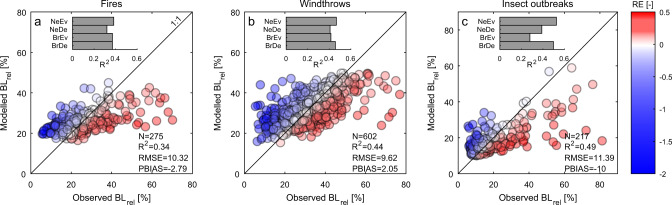
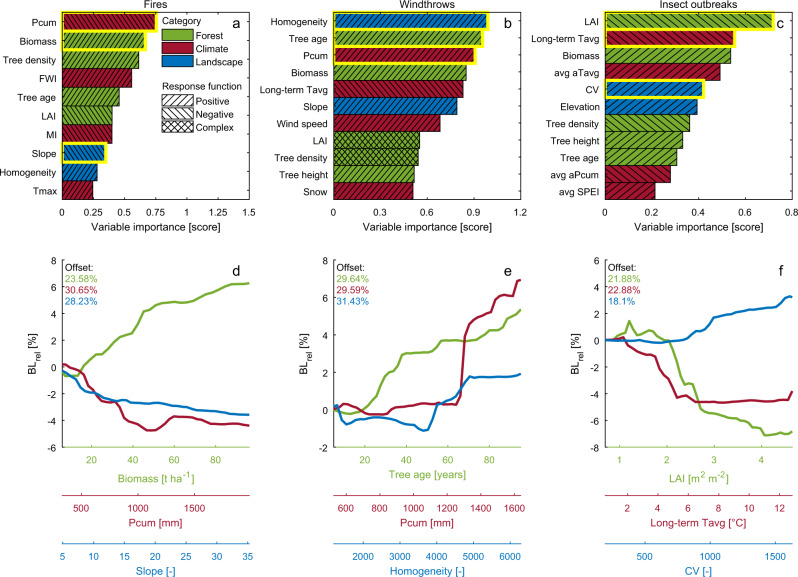
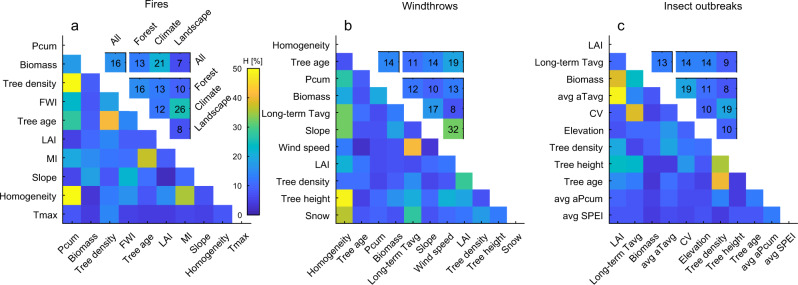
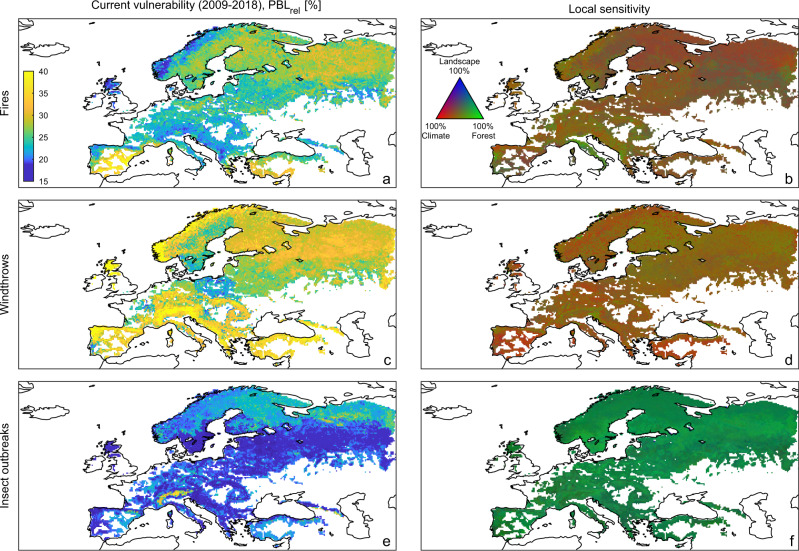
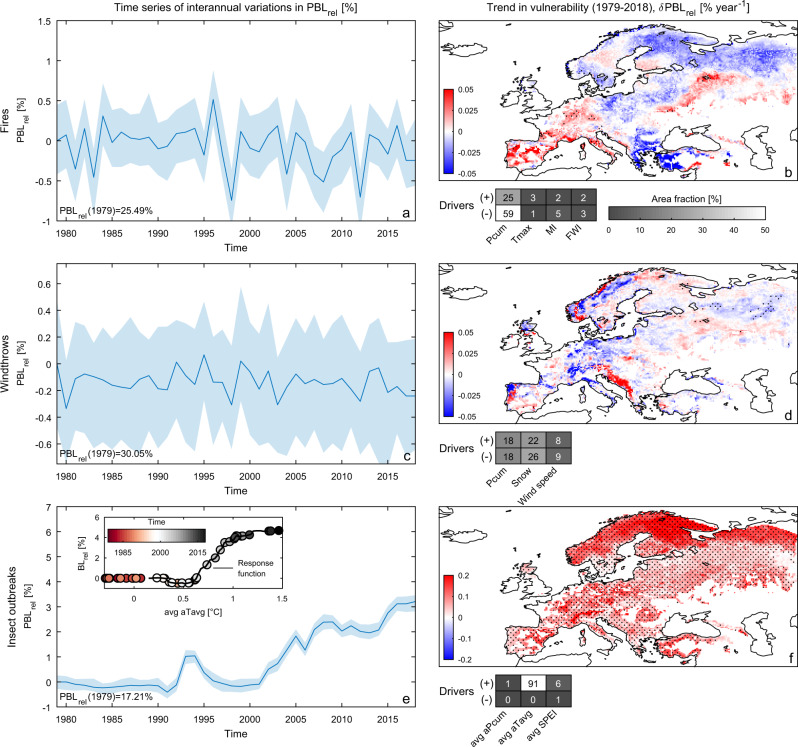
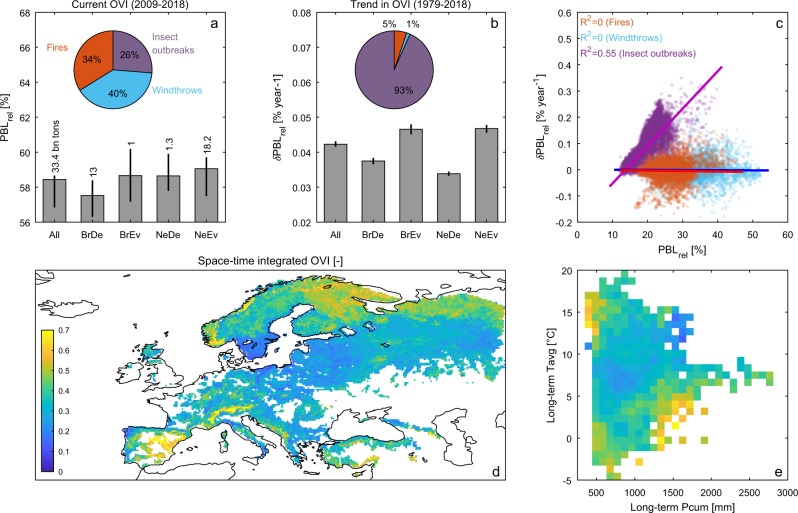
Forest disturbance regimes are expected to intensify as Earth's climate changes. Quantifying forest vulnerability to disturbances and understanding the underlying mechanisms is crucial to develop mitigation and adaptation strategies. However, observational evidence is largely missing at regional to continental scales. Here, we quantify the vulnerability of European forests to fires, windthrows and insect outbreaks during the period 1979-2018 by integrating machine learning with disturbance data and satellite products. We show that about 33.4 billion tonnes of forest biomass could be seriously affected by these disturbances, with higher relative losses when exposed to windthrows (40%) and fires (34%) compared to insect outbreaks (26%). The spatial pattern in vulnerability is strongly controlled by the interplay between forest characteristics and background climate. Hotspot regions for vulnerability are located at the borders of the climate envelope, in both southern and northern Europe. There is a clear trend in overall forest vulnerability that is driven by a warming-induced reduction in plant defence mechanisms to insect outbreaks, especially at high latitudes.


Conflict of interest statement

The authors declare no competing interests.

Figures

Fig. 1
Fig. 1. Validation of vulnerability models.
Observed versus modelled relative biomass losses (BLrel) due to a fires, b windthrows, and c insect outbreaks. Model estimates account for the mixture of different plant functional types (PFTs). Number of binned records (N), coefficient of determination (R2), root mean squared error (RMSE) and percent bias (PBIAS) are shown in labels, while relative error (RE) in colour. R2 values in the inset box refer to PFT-specific model performance: broadleaved deciduous (BrDe), broadleaved evergreen (BrEv), needle leaf deciduous (NeDe) and needle leaf evergreen (NeEv).
Fig. 2
Fig. 2. Response functions for forest vulnerability to natural disturbances.
a Selected predictors of relative biomass loss and corresponding variable importance based on the random forest regression model of forest vulnerability to fires. Colours distinguish the different categories (forest, climate, landscape) of environmental predictors (see Table 1), while the hatched fill patterns describe the prominent relationship of the response function. b and c as a but for vulnerability to windthrows and insect outbreaks, respectively. d Dependence of relative biomass loss (BLrel) due to fires for the most important predictors in each category—highlighted in yellow outline in panel a—as retrieved from zero-centred average partial dependence plots (PDP). Offset values are shown in label for each predictor. e and f as d but for vulnerability to windthrows and insect outbreaks, respectively.
Fig. 3
Fig. 3. Feature interaction strength in the response functions to natural disturbances.
a H-statistic for second-order interactions among environmental predictors of forest vulnerability to fires. Averaged values for different combinations of predictor categories (forest, climate, landscape) and for the whole set of features (“All”) are shown in the inset box (reported in colour and numbers). b and c as a but for vulnerability to windthrows and insect outbreaks, respectively. Predictor acronyms are listed in Table 1.
Fig. 4
Fig. 4. Spatial maps of current vulnerability of European forests to natural disturbances and local sensitivity to key drivers.
a Current vulnerability (PBLrel) of European forests to fires (averaged over the 2009–2018 period). b Marginal contribution of forest, climate and landscape features to the sensitivity of vulnerability to fires. c, d and e, f as a, b but for windthrows and insect outbreaks, respectively. Forests with cover fraction lower than 0.1 are masked in white.
Fig. 5
Fig. 5. Temporal variations in forest vulnerability to natural disturbances over the 1979–2018 period.
a Time series of vulnerability to fires (PBLrel) aggregated at Europe level and rescaled to the first year (1979) vulnerability value (shown at the bottom left). The blue line and the shaded patterns reflect the annual mean value and its 95% confidence interval, respectively. b Spatial map of the temporal trends in vulnerability to fires (δPBLrel); black dots show pixels where trends are significant (two-sided Mann–Kendall test; p value <0.05). Corresponding temporal drivers visualized in terms of area fraction (reported in colour and numbers) where the given driver is dominant. The positive and negative effect of each driver on vulnerability is distinguished by the symbols “+” and “−”, respectively. c, d and e, f as a, b but for windthrows and insect outbreaks, respectively. Inset box in panel e shows the average response function of the vulnerability to insect outbreaks along the observed gradient of temperature anomalies. Annual values of temperature anomalies aggregated at Europe level are overlaid on the response function and visualized in colour to capture their temporal evolution. Predictor acronyms are listed in Table 1.
Fig. 6
Fig. 6. Spatial and temporal patterns of the overall vulnerability of forests to multiple natural disturbances.
a Current overall vulnerability index (OVI expressed in terms of PBLrel) to multiple disturbances (averaged over the 2009–2018 period) and averaged over the whole domain (All) and separately for different plant functional types: broadleaved deciduous (BrDe), broadleaved evergreen (BrEv), needle leaf deciduous (NeDe) and needle leaf evergreen (NeEv). Bars represent the average value of the 15,797 0.25° grid cells weighted by their forest area extent; whiskers reflect the corresponding 95% confidence intervals while vertical labels report the total vulnerable biomass. The inset chart shows the marginal contribution of each natural disturbance to the OVI computed over the entire domain. b as a but for the trends in OVI computed for the 1979–2018 period (expressed in terms of δPBLrel). c Current grid-cell vulnerability and their trend for each disturbance type. Labels report the coefficient of determination of the linear regression shown as coloured lines. d Spatial map of the space-time integrated OVI. Forests with cover fraction lower than 0.1 are masked in white. e Space-time integrated OVI binned as a function of the long-term cumulated precipitation (on the x-axis) and average temperature (on the y-axis).

References

    1. Forest Europe. State of Europe’s Forests 2015 (Ministerial Conference on the Protection of Forests in Europe, Madrid, 2015).
    1. Mori AS, Lertzman KP, Gustafsson L. Biodiversity and ecosystem services in forest ecosystems: a research agenda for applied forest ecology. J. Appl. Ecol. 2017;54:12–27. doi: 10.1111/1365-2664.12669. - DOI
    1. Seidl R, et al. Forest disturbances under climate change. Nat. Clim. Change. 2017;7:395–402. doi: 10.1038/nclimate3303. - DOI - PMC - PubMed
    1. Trumbore S, Brando P, Hartmann H. Forest health and global change. Science. 2015;349:814–818. doi: 10.1126/science.aac6759. - DOI - PubMed
    1. Seidl R, Schelhaas M-J, Rammer W, Verkerk PJ. Increasing forest disturbances in Europe and their impact on carbon storage. Nat. Clim. Change. 2014;4:806–810. doi: 10.1038/nclimate2318. - DOI - PMC - PubMed

Publication types