. 2021 Feb 23;12(1):1242.
doi: 10.1038/s41467-020-20836-3.

Continent-wide tree fecundity driven by indirect climate effects

Affiliations

Continent-wide tree fecundity driven by indirect climate effects

James S Clark et al. Nat Commun. .

Erratum in

  • Author Correction: Continent-wide tree fecundity driven by indirect climate effects.
    Clark JS, Andrus R, Aubry-Kientz M, Bergeron Y, Bogdziewicz M, Bragg DC, Brockway D, Cleavitt NL, Cohen S, Courbaud B, Daley R, Das AJ, Dietze M, Fahey TJ, Fer I, Franklin JF, Gehring CA, Gilbert GS, Greenberg CH, Guo Q, HilleRisLambers J, Ibanez I, Johnstone J, Kilner CL, Knops J, Koenig WD, Kunstler G, LaMontagne JM, Legg KL, Luongo J, Lutz JA, Macias D, McIntire EJB, Messaoud Y, Moore CM, Moran E, Myers JA, Myers OB, Nunez C, Parmenter R, Pearse S, Pearson S, Poulton-Kamakura R, Ready E, Redmond MD, Reid CD, Rodman KC, Scher CL, Schlesinger WH, Schwantes AM, Shanahan E, Sharma S, Steele MA, Stephenson NL, Sutton S, Swenson JJ, Swift M, Veblen TT, Whipple AV, Whitham TG, Wion AP, Zhu K, Zlotin R. Clark JS, et al. Nat Commun. 2021 Mar 8;12(1):1664. doi: 10.1038/s41467-021-22025-2. Nat Commun. 2021. PMID: 33686080 Free PMC article. No abstract available.

Abstract

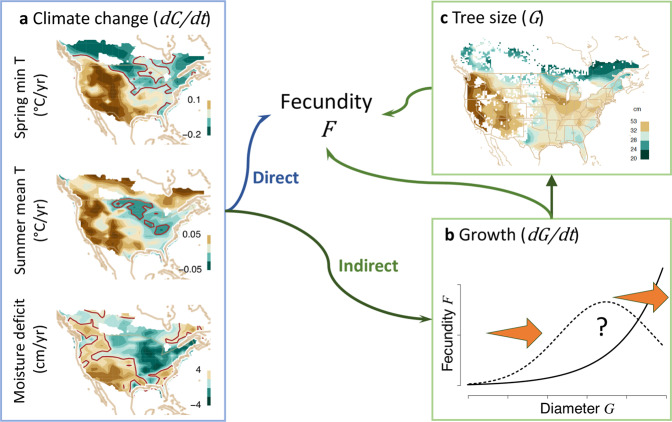
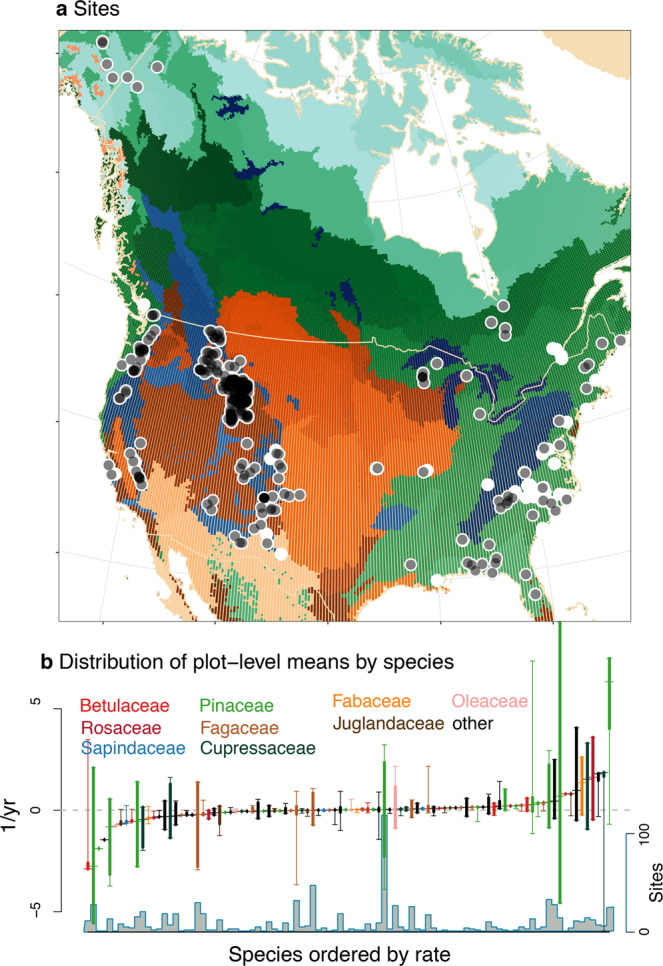
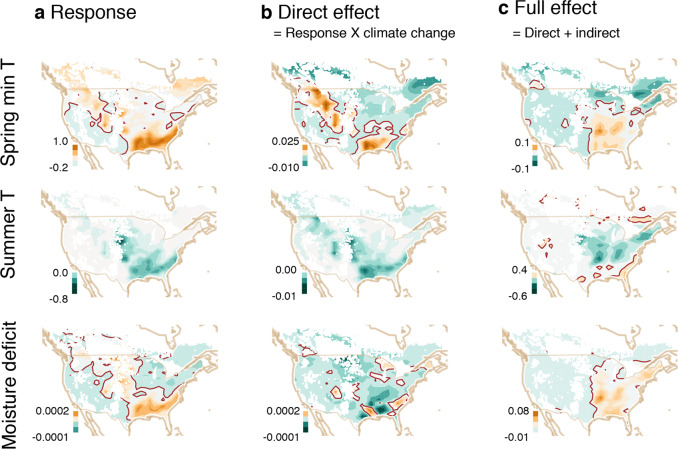
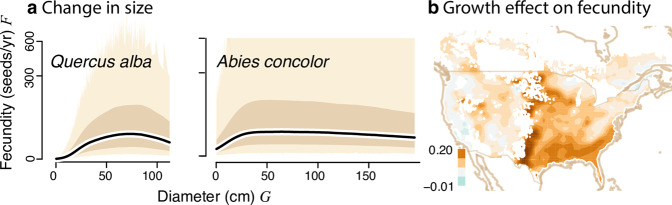
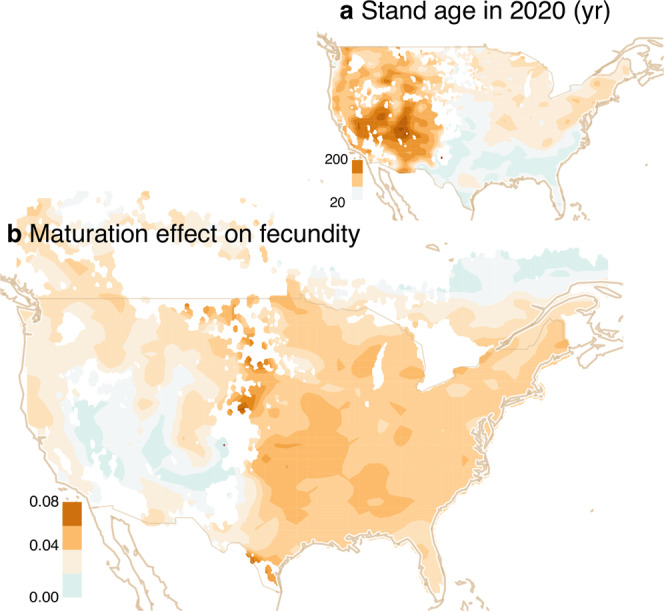
Indirect climate effects on tree fecundity that come through variation in size and growth (climate-condition interactions) are not currently part of models used to predict future forests. Trends in species abundances predicted from meta-analyses and species distribution models will be misleading if they depend on the conditions of individuals. Here we find from a synthesis of tree species in North America that climate-condition interactions dominate responses through two pathways, i) effects of growth that depend on climate, and ii) effects of climate that depend on tree size. Because tree fecundity first increases and then declines with size, climate change that stimulates growth promotes a shift of small trees to more fecund sizes, but the opposite can be true for large sizes. Change the depresses growth also affects fecundity. We find a biogeographic divide, with these interactions reducing fecundity in the West and increasing it in the East. Continental-scale responses of these forests are thus driven largely by indirect effects, recommending management for climate change that considers multiple demographic rates.


Conflict of interest statement

The authors declare no competing interests.

Figures

Fig. 1
Fig. 1. Longitudinal sites in the MASTIF network.
Colors match ecoregions in Fig. 3. Sites are listed by ecoregion in the Supplementary Data 1.
Fig. 2
Fig. 2. Trend attribution (TA) includes direct and indirect pathways for terms in Eq. (1).
a Trends in climate variables (since 1990) include minimum T in spring, mean summer T, and moisture deficit (D = cumulative monthly PET-P). The brown contour separates positive and negative trends. Shaded contours are green (decreasing) to brown (increasing). b Indirect effects have two elements. An arrow from b to F includes a growth effect (dG/dt) and a climate-growth interaction (C × dG/dt). An arrow from b to c depends on the uncertain relationship between tree diameter G and fecundity F shown in panel (b). If fecundity continues to increase with tree size (solid line in b), then accelerated growth (orange arrows are dG/dt) moves trees into more productive size classes, but not if fecundity eventually declines (dashed line). c Average diameter of trees (restricted to trees >20 cm) is high in the West, meaning that the effects of tree growth depend on [if] fecundity continues to increase or declines with size in panel (b). The effect of size on fecundity (arrow from c to F) comes through an interaction with climate (G × dC/dt in Eq. (1)).
Fig. 3
Fig. 3. Sites and species trends.
a Longitudinal studies in black (opacity proportional to numbers of sites) and opportunistic in white. Shaded ecoregions are desert/shrub/grass (browns), montane (blues), and mixed forest (greens). b Trends in mean log (proportionate) fecundity by species from sites in a range from negative (declining) to positive. As would be the case for any meta-analysis, the time scales for which trends are evaluated vary (see “Methods” section). Species belong to color-coded families below that are listed in Supplementary Data 2. There is no relationship with phylogeny (i.e., no trend in box color from left to right). Summaries in b include mean (crosshairs), 95% of site means (bold line), and range of site means (whiskers). The number of sites (n) contributing to b is shown below.
Fig. 4
Fig. 4. Continent-wide causes for fecundity trends.
Shaded contours are green (decreasing) to brown (increasing). Responses to climate variables (∂f/∂C) in a are multiplied by climate change (×dC/dt) in Fig. 2a to give the direct effect (∂f/∂C × dC/dt) in panel (b) (first term of Eq. (1)). The direct effect in b is added to the indirect effect that comes through tree growth (terms 2 and 3 of Eq. (1)) to give the full effect in panel (c). Units are proportionate change in fecundity per °C or per mm[-month] moisture deficit in panel (a) and per year in panels (b, c). White areas lack inventory plots. The brown contour indicates zero.
Fig. 5
Fig. 5. Indirect effects produce an East–West contrast.
a Fecundity rising then falling with size, for a common eastern hardwood (Q. alba) and western conifer (A. concolor) plotted on the square root scale. The predictive mean (black line) is bounded by the 90% credible interval (dark shading) and the 90% predictive interval (light shading) over all tree-years. b The growth effect includes terms in Eq. (1) that are multiplied by dG/dt, that is, ∂f/∂G + ∂f/∂(GC) × C (units are log f/yr). Averages shift from positive in the East to near zero or negative in the West, where more trees are near or past the diameter where growth stimulation increases fecundity.
Fig. 6
Fig. 6. Distribution of observation trees by year in the North American region of the MASTIF network.
Sites are listed by ecoregion in the Supplementary Data 2.
Fig. 7
Fig. 7. Size and maturation effects on fecundity.
a Stand age variable in FIA data and b positive effect of maturation for increasing fecundity in the eastern continent. In the West, maturation does not contribute to rising fecundity because large trees are predominantly [mature] larger.

References

    1. Schwantes AM, et al. Measuring canopy loss and climatic thresholds from an extreme drought along a fivefold precipitation gradient across texas. Glob. Change Biol. 2017;23:5120–5135. - PubMed
    1. Seidl R, et al. Forest disturbances under climate change. Nat. Clim. Change. 2017;7:395–402. - PMC - PubMed
    1. Williams AP, et al. Large contribution from anthropogenic warming to an emerging North American megadrought. Science. 2020;368:314–318. - PubMed
    1. Clark JS, et al. The impacts of increasing drought on forest dynamics, structure, and biodiversity in the united states. Glob. Change Biol. 2016;22:2329–2352. - PubMed
    1. McDowell, N. et al. Pervasive shifts in forest dynamics in a changing world. Science (in the press). - PubMed

Publication types