Comparative Study
. 2021 Feb 23;11(1):4356.
doi: 10.1038/s41598-021-83428-1.

Comparing different approaches for operationalizing subjective cognitive decline: impact on syndromic and biomarker profiles

Affiliations
Comparative Study

Comparing different approaches for operationalizing subjective cognitive decline: impact on syndromic and biomarker profiles

Patricia Diaz-Galvan et al. Sci Rep. .

Abstract

Subjective cognitive decline (SCD) has been proposed as a risk factor for future cognitive decline and dementia. Given the heterogeneity of SCD and the lack of consensus about how to classify this condition, different operationalization approaches still need to be compared. In this study, we used the same sample of individuals to compare different SCD operationalization approaches. We included 399 cognitively healthy individuals from a community-based cohort. SCD was assessed through nine questions about memory and non-memory subjective complaints. We applied four approaches to operationalize SCD: two hypothesis-driven approaches and two data-driven approaches. We characterized the resulting groups from each operationalization approach using multivariate methods on comprehensive demographic, clinical, cognitive, and neuroimaging data. We identified two main phenotypes: an amnestic phenotype characterized by an Alzheimer's Disease (AD) signature pattern of brain atrophy; and an anomic phenotype, which was mainly related to cerebrovascular pathology. Furthermore, language complaints other than naming helped to identify a subgroup with subclinical cognitive impairment and difficulties in activities of daily living. This subgroup also showed an AD signature pattern of atrophy. The identification of SCD phenotypes, characterized by different syndromic and biomarker profiles, varies depending on the operationalization approach used. In this study we discuss how these findings may be used in clinical practice and research.


Conflict of interest statement

The authors declare no competing interests.

Figures
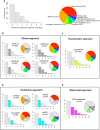
Figure 1
Figure 1
Overview of subjective cognitive complaints and SCD groups in the GENIC cohort. (a) Frequency of subjective cognitive complaints. (b–e) Overview of the SCD groups according to the four operationalization approaches. All the bar charts show number of subjective cognitive complaints in the x-axis and the frequency (n) in the y-axis. HC, healthy controls; aSCD-sd = amnestic Subjective Cognitive Decline—single domain; aSCD-md, amnestic Subjective Cognitive Decline—multiple domain; naSCD-sd, non-amnestic Subjective Cognitive Decline—single domain; naSCD-md, non-amnestic Subjective Cognitive Decline—multiple domain; SCD-90thPC, Subjective Cognitive Decline defined by the presence of two or more cognitive complaints, corresponding to the 90thPC of the total number of complaints variables; anSCD, anomic Subjective Cognitive Decline; amSCD, amnestic Subjective Cognitive Decline; am-anSCD, amnestic and anomic Subjective Cognitive Decline; atSCD, atypical Subjective Cognitive Decline; SCD-multivariate, Subjective Cognitive Decline defined by the presence of language production, language comprehension and/or writing complaint alone or in combination with other complaints.
Figure 2
Figure 2
Identification of SCD subtypes in the Distribution approach. Cross-table of frequencies between each quartile of the variable ‘total number of complaints’ and the variables of ‘memory’ and ‘word-finding’ complaints. anSCD, anomic Subjective Cognitive Decline; amSCD, amnestic Subjective Cognitive Decline; am-anSCD, amnestic and anomic Subjective Cognitive Decline; atSCD, atypical Subjective Cognitive Decline.
Figure 3
Figure 3
Overlap between the four SCD operationalization approaches. Percentage values indicate the frequency of individuals with subjective complaints classified as SCD by the different approaches and their combination.
Figure 4
Figure 4
Cognitive profile of the SCD groups—Borderline performance. Percentage of SCD individuals with cognitive performance below the 10th percentile is reported for each SCD operationalization approach and subtype. The y-axis shows the percentage of SCD individuals below the 10th percentile. Higher percentage indicates that more individuals in a given group have borderline performance. This analysis was conducted only using SCD data. All the scores were previously adjusted for age, sex, and the WAIS-III Information subtest using multiple linear regression. The five components obtained in the PCA (Principal Component Analysis) were selected for this analysis. aSCD-sd, amnestic Subjective Cognitive Decline—single domain; aSCD-md, amnestic Subjective Cognitive Decline—multiple domain; naSCD-sd, non-amnestic Subjective Cognitive Decline—single domain; naSCD-md, non-amnestic Subjective Cognitive Decline—multiple domain; SCD-90thPC, Subjective Cognitive Decline defined by the presence of two or more cognitive complaints, corresponding to the 90thPC of the total number of complaints variable; anSCD, anomic Subjective Cognitive Decline; amSCD, amnestic Subjective Cognitive Decline; am-anSCD, amnestic and anomic Subjective Cognitive Decline; atSCD, atypical Subjective Cognitive Decline; SCD-multivariate, Subjective Cognitive Decline defined by the presence of language production, language comprehension and/or writing complaints alone or in combination with other complaints.
Figure 5
Figure 5
AD signature atrophy pattern versus WMSA load. The AD signature atrophy pattern and the WMSA load are treated as continuous variables in all the analyses in this study. Only for representation purposes in this figure, both measures were dichotomized to reflect an AD-like pattern of brain atrophy and high load of WMSA. This was done by using the 90th percentile cut-off as in previous studies. The distribution of SCD and HC individuals (color legend) was plotted and, for each quadrant, the percentage of SCD individuals is reported. HC, healthy controls; SCD, subjective cognitive decline; WMSA, white matter signal abnormalities; AD, Alzheimer’s disease.

Similar articles

Cited by

References

    1. Jessen F, et al. A conceptual framework for research on subjective cognitive decline in preclinical Alzheimer’s disease. Alzheimers. Dement. 2014;10:844–852. doi: 10.1016/j.jalz.2014.01.001. - DOI - PMC - PubMed
    1. Diniz BS, Butters MA, Albert SM, Dew MA, Reynolds CF. Late-life depression and risk of vascular dementia and Alzheimer’s disease: systematic review and meta-analysis of community-based cohort studies. Br. J. Psychiatry. 2013;202:329–335. doi: 10.1192/bjp.bp.112.118307. - DOI - PMC - PubMed
    1. Molinuevo JL, et al. Implementation of subjective cognitive decline criteria in research studies. Alzheimers. Dement. 2017;13:296–311. doi: 10.1016/j.jalz.2016.09.012. - DOI - PMC - PubMed
    1. Reisberg B, Gauthier S. Current evidence for subjective cognitive impairment (SCI) as the pre-mild cognitive impairment (MCI) stage of subsequently manifest Alzheimer’s disease. Int. Psychogeriatr. 2008;20:1–16. doi: 10.1017/S1041610207006412. - DOI - PubMed
    1. Rabin LA, et al. Subjective cognitive decline in older adults: an overview of self-report measures used across 19 international research studies. J. Alzheimers. Dis. 2015;48(Suppl 1):S63–86. doi: 10.3233/JAD-150154. - DOI - PMC - PubMed

Publication types