. 2021 Feb 23;11(1):4404.
doi: 10.1038/s41598-021-83845-2.

Quantifying cell death induced by doxorubicin, hyperthermia or HIFU ablation with flow cytometry

Affiliations

Quantifying cell death induced by doxorubicin, hyperthermia or HIFU ablation with flow cytometry

Paul Christopher Lyon et al. Sci Rep. .

Abstract

Triggered release and targeted drug delivery of potent anti-cancer agents using hyperthermia-mediated focused-ultrasound (FUS) is gaining momentum in the clinical setting. In early phase studies, tissue biopsy samples may be harvested to assess drug delivery efficacy and demonstrate lack of instantaneous cell death due to FUS exposure. We present an optimised tissue cell recovery method and a cell viability assay, compatible with intra-cellular doxorubicin. Flow cytometry was used to determine levels of cell death with suspensions comprised of: (i) HT29 cell line exposed to hyperthermia (30 min at 47 °C) and/or doxorubicin, or ex-vivo bovine liver tissue exposed to (ii) hyperthermia (up to 2 h at 45 °C), or (iii) ablative high intensity FUS (HIFU). Flow cytometric analysis revealed maximal cell death in HT29 receiving both heat and doxorubicin insults and increases in both cell granularity (p < 0.01) and cell death (p < 0.01) in cells recovered from ex-vivo liver tissue exposed to hyperthermia and high pressures of HIFU (8.2 MPa peak-to-peak free-field at 1 MHz) relative to controls. Ex-vivo results were validated with microscopy using pan-cytokeratin stain. This rapid, sensitive and highly quantitative cell-viability method is applicable to the small masses of liver tissue typically recovered from a standard core biopsy (5-20 mg) and may be applied to tissues of other histological origins including immunostaining.


Conflict of interest statement

The authors declare no competing interests.

Figures

Figure 1
Figure 1
Schematic depicting the use of an extracorporeal USgFUS device (JC-200, Chongqing Haifu Medical Technology Co., Ltd.) and implanted thermistor for targeted LTLD delivery to liver tumours in the TARDOX study, Oxford, UK. RIGHT: LTLD was infused intravenously prior to FUS and biopsies of the target tumour were taken before and after infusion and finally after FUS exposure. LEFT: illustrative thermistor trace obtained for the first patient treated, demonstrating the approximate range of sub-ablative levels of hyperthermia sought (39.5–42 °C) centrally within the target tumour.
Figure 2
Figure 2
Experimental images of ablated ex-vivo bovine liver. LEFT: N = 3 HIFU lesions for each of H = High = 8.2 MPa (peak-to-peak), M = Medium = 7.3 MPa and L = Low = 6.3 MPa acoustic pressures obtained in freshly harvested degassed ex vivo bovine liver. Liver tissue remains in watertight tissue holder with the acoustic window removed and has been sliced transversely at the axial focus (2 cm depth). Lesions for each pressure regime are staggered across rows to help locate the (more subtle) low power lesions relative to the other lesions. RIGHT: A biopsy sample of 6.2 mg liver mass exposed to low HIFU pressures obtained from the L1 lesion before (TOP) and after (BOTTOM) physical disaggregation using crossed scalpels in petri dish, prior to enzymatic digestion.
Figure 3
Figure 3
Flow cytometric studies (dot plot, histograms) of viable HT29 cell suspension exposed to high concentration doxorubicin (RIGHT) 2 h previously or not (LEFT). Samples are either unstained detected using FL2 channel (excitation/emission 488/585 ± 42 nm) (top row), stained with propidium iodide detected using the same FL2 channel (middle row), or the far-red L/D stain detected using FL-4 channel (633/660 ± 16 nm) (bottom row). On the logarithmic FL-4 scale, the vertical line represents the fluorescence gating threshold, with events to the left of the line representing viable cells, and events to the right of the line representing positive staining by the viability, i.e. what might be expected to be non-viable cells. Percentage of cell viability (top left, dot plot) vs. death (top right, dot plot) are demonstrated within the gated areas. However, note that the PI stain gives a misleading impression of near complete cell death in the only very recently doxorubicin-exposed cells due to the overlap with doxorubicin’s wide fluorescent emission profile, when in reality there has been insufficient time for true cell necrosis. Events with FSC < 100 discarded, presumed to represent debris and/or impurities, with around 90% events included for analysis. Plots generated using FlowJo Data Analysis Software.
Figure 4
Figure 4
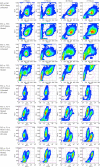
Flow cytometric studies of HT29 cell suspensions with and without 100 µg/g doxorubicin exposure and/or 30 min of 47 °C hyperthermia. Viability analysis performed using L/D stain, assayed at 2, 6, 48 and 72-h (Columns 1–4). Rows 1–4: Side Scatter (SSC) vs. Forward scatter (FSC) with population of likely viable cancer cells selected by a circle, expressed percentage of all events centrally within the circle. No events discarded. Rows 5–8: FSC vs. far-red FL-4 channel (633/660 ± 16 nm) (see methods). 10,000 events recorded and events with FSC < 100 AU discarded, presumed to represent cell debris and/or impurities. Percentage of cell viability (top left) vs. death (top right) are demonstrated within the larger (outer) gated areas. The events within the viable cell gate with FSC between 100 and 200 AU are presumed to represent apoptotic bodies, and these have been excluded using a smaller sub-gate, with percentage of all events within that gate just above the FSC = 200 AU line. Plots generated using FlowJo Data Analysis Software.
Figure 5
Figure 5
Summary plot of cell viability analysis for HT29 cells exposed to insults of either high dose doxorubicin (100 µg/mg) and/or 47 °C hyperthermia with controls, using L/D viability stain. Cells assayed at 2, 6, 24 48 and 72-h. There is more rapid and near-complete cell death in the group receiving both insults compared with the groups receiving a single insult, and minimal cell death is demonstrated in the control. Of note, if debris particles considered to be ‘apoptotic bodies’ are excluded, the results indicate near-total cell kill in the group receiving both insults at 72-h (blue dotted line).
Figure 6
Figure 6
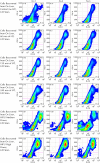
Cell viability flow cytometric studies of cells recovered from control liver and liver exposed to varying durations of hyperthermia and powers of HIFU. Each condition was performed in triplicate, i.e. three bags with liver sample exposed to hyperthermia and three liver lesions were performed and sampled individually at each HIFU power (N = 3, Columns). Representative plots for 0, 60, 120 and 240 min of hyperthermia (rows 1–4) and medium (7.27 MPa) and high (8.19 MPa) HIFU powers (rows 5–6) shown using FSC vs. far-red FL-4 channel (633/660 ± 16 nm). Events with FSC < 70 and/or FL-4 < 300 discarded, presumed to represent cell debris and/or impurities. Viability assessed using L/D stain. Trend for increased L/D staining intensity with samples receiving increasing insults, most markedly in the high power HIFU group, compared to the control group. Plots generated using FlowJo Data Analysis Software.
Figure 7
Figure 7
Cell viability analysis for ex vivo bovine liver experiments. (a) Mean cell viability plot of cells recovered from control liver and liver exposed to varying durations of hyperthermia (45 °C) assayed at 16 h (N = 3). One-way ANOVA with Fisher’s LSD revealed significant increase in cell death (p < 0.01) for the groups treated with 60, 120 and 240 -min of hyperthermia when compared to the control, 15- and 30-min groups in any combination for both PI and L/D stains (**). (b) Cell granularity analysis for the same (hyperthermia) group (N = 3). One-way ANOVA with Fishers LSD revealed a significant increase (p < 0.01) in granularity (SSC) for the 60-to-240-min hyperthermia exposure groups when compared to the control. (c) Mean cell viability plot of cells recovered from control liver and HIFU-ablated lesions fixed at 4 h and assayed the following day (N = 3). One-way ANOVA with Fisher’s LSD revealed significant increase in cell death (p < 0.01) in both the medium and high-power groups compared to both the control group in any combination for the L/D stain (*). (d) Cell granularity analysis for the same (HIFU) group (N = 3). One-way ANOVA with Fishers LSD revealed a significant increase (p < 0.01) in granularity (SSC) for the medium and high HIFU exposure groups when compared to the control.
Figure 8
Figure 8
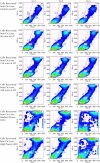
SSC and FSC flow cytometric studies of cells recovered from control liver and liver exposed to varying durations of hyperthermia and powers of HIFU (N = 3, Columns). Representative plots for 0, 60, 120 and 240-min of hyperthermia (rows 1–4) and medium (7.27 MPa) and high (8.19 MPa) HIFU powers (rows 5–6) shown. Sub-populations have been gated, with gates labelled in top-left plot only. Plots demonstrate a trend for at first increased FSC (moving from R1 to R2), followed by dramatically increased SSC and FSC (cells moving from R1/R2 populations to R4) with increasing severity of hyperthermic or ablative insults, consequent with larger cell size and granularity. Events with FSC < 70 discarded. Plots generated using FlowJo Data Analysis Software.
Figure 9
Figure 9
Immunohistochemistry of HIFU-ablated ex-vivo bovine liver exposed to 8.2 MPa peak-to-peak. H&E (left column) and pan-CK microscopy at ×20 of control sample (top row) and HIFU-exposed sample (bottom row). Insets of macroscopic samples shown in the top left corner of H&E images. Microscopy was taken at lesion edge which was clearly defined in the case of pan-CK but less easily distinguished with H&E. H&E of the HIFU-ablated liver demonstrates distinct cellular margins, subtle loss of some nuclear stain and occasional haemorrhagic foci. The dotted lines in the HIFU-ablated pan-CK sample (bottom right) demonstrate an approximate 300 µm transition zone of some viable hepatocytes between viable cells (below, positive staining) and non-vital hepatocytes (above, negative staining). The bile ducts are noted to stain strongly, regardless of HIFU exposure (dark brown).
Figure 10
Figure 10
Simulations of expected temperature rises obtained in the ex-vivo liver tissue performed using non-perfused and non-linear KZK model. TOP: Temperature plots were simulated for a single continuous wave 10 s sonication at the transducer’s focal depth of 51.7 mm penetrating 20 mm into tissue. The solid red curve represents high liver attenuation, the dotted red curve average liver attenuation and the blue, low liver attenuation. BOTTOM (Rows 2–4): Temperature maps were simulated using the same parameters at low (row 2), average (row 3) and high (row 4) liver attenuation. Left Column: 6.34 MPa, Middle Column: 7.27 MPa, Right Column: 8.19 MPa peak-to-peak acoustic pressures.

Similar articles

Cited by

References

    1. Nakazawa T, et al. Radiofrequency ablation of hepatocellular carcinoma: Correlation between local tumor progression after ablation and ablative margin. Am. J. Roentgenol. 2007;188(2):480. doi: 10.2214/AJR.05.2079. - DOI - PubMed
    1. Engelhardt R. Rational for clinical application of hyperthermia and drugs. Rev. Med. Chir. Soc. Med. Nat. Iasi. 1987;91(2):347. - PubMed
    1. Kowal CD, Bertino JR. Possible benefits of hyperthermia to chemotherapy. Cancer Res. 1979;39(6):2285–2289. - PubMed
    1. Issels RD. Hyperthermia adds to chemotherapy. Eur. J. Cancer. 2008;44:2546. doi: 10.1016/j.ejca.2008.07.038. - DOI - PubMed
    1. Needham D, Anyarambhatla G, Kong G, Dewhirst MW. A new temperature-sensitive liposome for use with mild hyperthermia: Characterization and testing in a human tumor xenograft model. Cancer Res. 2000;60(5):1197–1201. - PubMed

Publication types

LinkOut - more resources