. 2021 Feb 23;11(1):4390.
doi: 10.1038/s41598-021-83796-8.

Screening of metabolic modulators identifies new strategies to target metabolic reprogramming in melanoma

Affiliations

Screening of metabolic modulators identifies new strategies to target metabolic reprogramming in melanoma

Cecilie Abildgaard et al. Sci Rep. .

Abstract

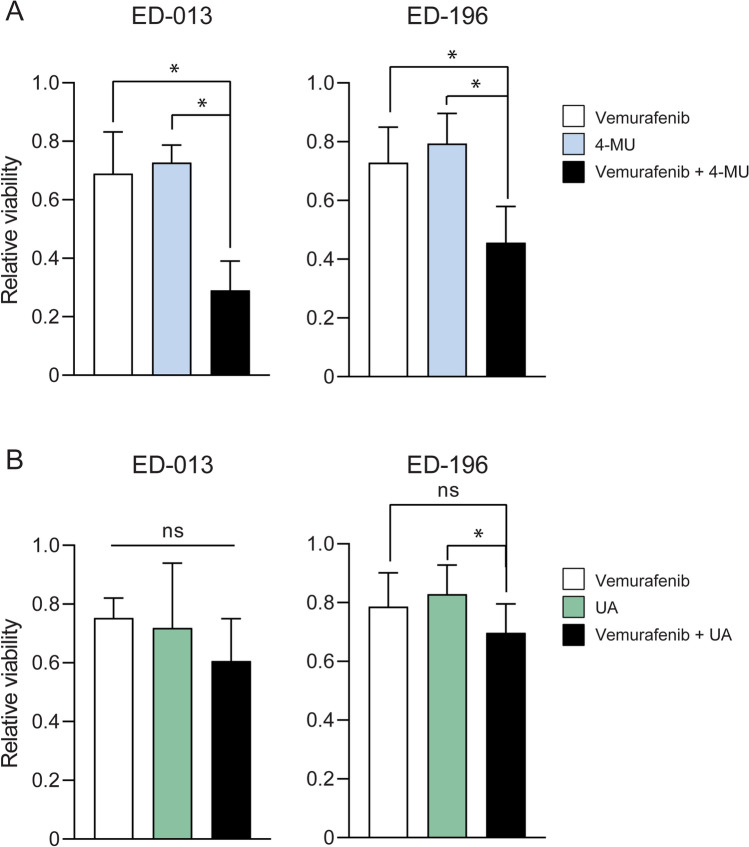
The prognosis of metastatic melanoma remains poor due to de novo or acquired resistance to immune and targeted therapies. Previous studies have shown that melanoma cells have perturbed metabolism and that cellular metabolic pathways represent potential therapeutic targets. To support the discovery of new drug candidates for melanoma, we examined 180 metabolic modulators, including phytochemicals and anti-diabetic compounds, for their growth-inhibitory activities against melanoma cells, alone and in combination with the BRAF inhibitor vemurafenib. Two positive hits from this screen, 4-methylumbelliferone (4-MU) and ursolic acid (UA), were subjected to validation and further characterization. Metabolic analysis showed that 4-MU affected cellular metabolism through inhibition of glycolysis and enhanced the effect of vemurafenib to reduce the growth of melanoma cells. In contrast, UA reduced mitochondrial respiration, accompanied by an increase in the glycolytic rate. This metabolic switch potentiated the growth-inhibitory effect of the pyruvate dehydrogenase kinase inhibitor dichloroacetate. Both drug combinations led to increased production of reactive oxygen species, suggesting the involvement of oxidative stress in the cellular response. These results support the potential use of metabolic modulators for combination therapies in cancer and may encourage preclinical validation and clinical testing of such treatment strategies in patients with metastatic melanoma.


Conflict of interest statement

The authors declare no competing interests.

Figures

Figure 1
Figure 1
Effects of 4-MU and UA on cellular metabolism. Mitochondrial (A) and glycolytic (B) profiles of ED-013, ED-117 and ED-196 cells treated with 4-MU (100 μM; upper panel) or UA (10 μM; lower panel) for 24 h compared to untreated controls. The data points represent the mean ± SD of 6 parallel Seahorse XFe96 measurements of OCR (A) and ECAR (B) during successive injection of glucose (10 mM), oligomycin (2 μM), FCCP (1 μM) and rotenone/antimycin (1 μM/1 μM). (*p < 0.05; ** p < 0.01; *** p < 0.001; **** p < 0.0001; ns—not significant).
Figure 2
Figure 2
Effects on melanoma cell viability of 4-MU and UA in combination with vemurafenib. Relative viability of ED-013 and ED-196 cells was determined with crystal violet staining after treatment with (A) 4-MU (400 µM), vemurafenib (0.1 µM) and the combination, or (B) UA (10 µM), vemurafenib (0.1 µM) and the combination for 6 days. A one-way ANOVA was performed to determine variance between the treatment groups. Data represent the mean ± SD of 3 individual experiments. Tukey’s HSD test was performed to determine statistical significance (*p < 0.05; ns—not significant).
Figure 3
Figure 3
Effects of UA and DCA on melanoma cell viability. Relative viability of ED-013, ED-117 and ED-196 cells was determined with crystal violet staining after treatment with UA (10 µM), DCA (10 mM) and the combination for 6 days. A one-way ANOVA was performed to determine variance between the treatment groups. Data represent average values ± SD of 3 individual experiments. Tukey’s HSD test was performed to determine statistical significance (*p < 0.05; ** p < 0.01; ns—not significant).
Figure 4
Figure 4
Effects of 4-MU + vemurafenib and UA + DCA on the production of superoxide. Cytofluorimetric determination of cellular superoxide p < A) and mitochondrial superoxide (B) in ED-013 and ED-196 melanoma cells upon incubation with the probes DHE and MitoSOX, respectively. Cells were treated with 4-MU (100 µM) in combination with vemurafenib (0.1 µM), or with UA (10 µM) in combination with DCA (10 mM) for 24 or 48 h. Values are reported as relative fluorescence in treated cells compared to vehicle only (DMSO)-treated cells. Data represent the mean ± SEM of 3 independent experiments done in triplicate. An unpaired t-test was performed to determine statistical significance (*p < 0.05; ** p < 0.01, *** p < 0.001).
Figure 5
Figure 5
Cytostatic and cytotoxic effects of 4-MU + vemurafenib and UA + DCA in melanoma cells. (A) Cytofluorimetric evaluation of cell cycle in ED-013 and ED-196 melanoma cells upon incubation with propidium iodide (PI) upon treatment with 4-MU (100 µM) + vemurafenib (0.1 µM), or UA (10 µM) + DCA (10 mM) for 48 h. Percent of cells in the different phases of cell cycle was determined by FlowJo v 10.1 software. Data show the mean of 3 independent experiments ± SD. A two-way ANOVA was performed to determine statistical significance (**p < 0.01, *** p < 0.001). Representative plots are shown on the right. (B) Percentage of apoptotic cells in culures of ED-013 and ED-196 treated with 4-MU + vemurafenib or UA + CA for 24 or 48 h. The hypodiploid nuclei (subG1) population was gated by flow cytometry upon staining with PI. Data represent the mean ± SD of 3 independent experiments. An unpaired t-test was performed to determine statistical significance (*p < 0.05; *** p < 0.001). (C) Analysis of cell viability in the same cell lines upon staining with Alamar Blue (AB) upon 48 h of treatment with UA in combination with DCA in the presence or absence of the antioxidant N-acetyl-l-cysteine (NAC, 5 mM). DMSO was used as vehicle. Values are reported as relative fluorescence of AB in treated compared to untreated cells. Data represent the mean ± SD of 3 independent experiments. An unpaired t-test was performed to determine statistical significance (*p < 0.05).

References

    1. Ferlay J, et al. Estimating the global cancer incidence and mortality in 2018: GLOBOCAN sources and methods. Int. J. Cancer. 2019;144:1941–1953. doi: 10.1002/ijc.31937. - DOI - PubMed
    1. Eggermont AM, Spatz A, Robert C. Cutaneous melanoma. Lancet. 2014;383:816–827. doi: 10.1016/S0140-6736(13)60802-8. - DOI - PubMed
    1. Bai X, Flaherty KT. Targeted and immunotherapies in BRAF mutant melanoma: where we stand and what to expect. Br. J. Dermatol. 2020 doi: 10.1111/bjd.19394. - DOI - PubMed
    1. Scott DA, et al. Comparative metabolic flux profiling of melanoma cell lines: beyond the Warburg effect. J. Biol. Chem. 2011;286:42626–42634. doi: 10.1074/jbc.M111.282046. - DOI - PMC - PubMed
    1. Warburg O, Wind F, Negelein E. The metabolism of tumors in the body. J. Gen. Physiol. 1927;8:519–530. doi: 10.1085/jgp.8.6.519. - DOI - PMC - PubMed

Publication types

MeSH terms