

Modelling the spatiotemporal complexity of interactions between pathogenic bacteria and a phage with a temperature-dependent life cycle switch
- PMID: 33623124
- PMCID: PMC7902855
- DOI: 10.1038/s41598-021-83773-1
Modelling the spatiotemporal complexity of interactions between pathogenic bacteria and a phage with a temperature-dependent life cycle switch
Abstract
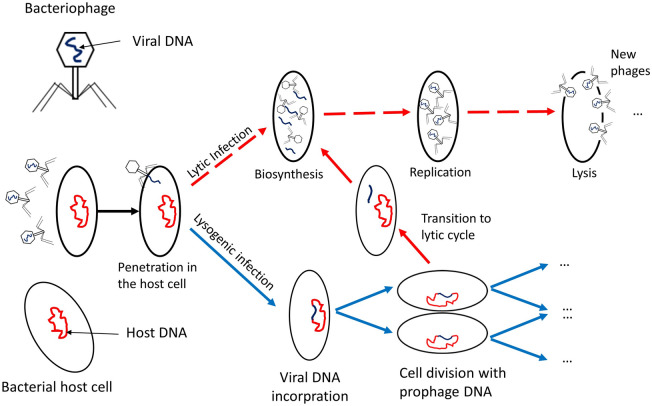
We apply mathematical modelling to explore bacteria-phage interaction mediated by condition-dependent lysogeny, where the type of the phage infection cycle (lytic or lysogenic) is determined by the ambient temperature. In a natural environment, daily and seasonal variations of the temperature cause a frequent switch between the two infection scenarios, making the bacteria-phage interaction with condition-dependent lysogeny highly complex. As a case study, we explore the natural control of the pathogenic bacteria Burkholderia pseudomallei by its dominant phage. B. pseudomallei is the causative agent of melioidosis, which is among the most fatal diseases in Southeast Asia and across the world. We assess the spatial aspect of B. pseudomallei-phage interactions in soil, which has been so far overlooked in the literature, using the reaction-diffusion PDE-based framework with external forcing through daily and seasonal parameter variation. Through extensive computer simulations for realistic biological parameters, we obtain results suggesting that phages may regulate B. pseudomallei numbers across seasons in endemic areas, and that the abundance of highly pathogenic phage-free bacteria shows a clear annual cycle. The model predicts particularly dangerous soil layers characterised by high pathogen densities. Our findings can potentially help refine melioidosis prevention and monitoring practices.
Conflict of interest statement
The authors declare no competing interests.
Figures
Similar articles
-
Modelling the effects of climate change on the interaction between bacteria and phages with a temperature-dependent lifecycle switch.Sci Rep. 2025 Feb 21;15(1):6428. doi: 10.1038/s41598-025-89307-3. Sci Rep. 2025. PMID: 39984516 Free PMC article.
-
Temperature-dependent virus lifecycle choices may reveal and predict facets of the biology of opportunistic pathogenic bacteria.Sci Rep. 2018 Jun 25;8(1):9642. doi: 10.1038/s41598-018-27716-3. Sci Rep. 2018. PMID: 29941954 Free PMC article.
-
LYTIC CAPABILITY OF BACTERIOPHAGES (FAMILY MYOVIRIDAE) ON BURKHOLDERIA PSEUDOMALLEI.Southeast Asian J Trop Med Public Health. 2014 Nov;45(6):1344-53. Southeast Asian J Trop Med Public Health. 2014. PMID: 26466420
-
Diversity of phage infection types and associated terminology: the problem with 'Lytic or lysogenic'.FEMS Microbiol Lett. 2016 Apr;363(7):fnw047. doi: 10.1093/femsle/fnw047. Epub 2016 Feb 29. FEMS Microbiol Lett. 2016. PMID: 26925588 Review.
-
Burkholderia pseudomallei infection in a Puerto Rican patient with chronic granulomatous disease: case report and review of occurrences in the Americas.Clin Infect Dis. 1998 Apr;26(4):889-94. doi: 10.1086/513928. Clin Infect Dis. 1998. PMID: 9564470 Review.
Cited by
-
Generation of Distinct Differentially Culturable Forms of Burkholderia following Starvation at Low Temperature.Microbiol Spectr. 2022 Feb 23;10(1):e0211021. doi: 10.1128/spectrum.02110-21. Epub 2022 Jan 5. Microbiol Spectr. 2022. PMID: 34985335 Free PMC article.
-
Modelling the effects of climate change on the interaction between bacteria and phages with a temperature-dependent lifecycle switch.Sci Rep. 2025 Feb 21;15(1):6428. doi: 10.1038/s41598-025-89307-3. Sci Rep. 2025. PMID: 39984516 Free PMC article.
-
Characterization of Mu-Like Yersinia Phages Exhibiting Temperature Dependent Infection.Microbiol Spectr. 2023 Aug 17;11(4):e0020323. doi: 10.1128/spectrum.00203-23. Epub 2023 Jul 19. Microbiol Spectr. 2023. PMID: 37466430 Free PMC article.
-
Phenotypic Characterization and Genome Analysis of New Broad-Spectrum Virulent Salmophage, Salmonella Phage KKP_3822, for Biocontrol of Multidrug-Resistant Salmonella enterica Strains.Int J Mol Sci. 2024 Dec 1;25(23):12930. doi: 10.3390/ijms252312930. Int J Mol Sci. 2024. PMID: 39684641 Free PMC article.
-
Mathematical model of COVID-19 with comorbidity and controlling using non-pharmaceutical interventions and vaccination.Nonlinear Dyn. 2021;106(2):1213-1227. doi: 10.1007/s11071-021-06517-w. Epub 2021 May 19. Nonlinear Dyn. 2021. PMID: 34031622 Free PMC article.
References
-
- Wilhelm SW, Suttle CA. Viruses and nutrient cycles in the sea: Viruses play critical roles in the structure and function of aquatic food webs. Bioscience. 1999;49:781–788. doi: 10.2307/1313569. - DOI
Publication types
MeSH terms
Grants and funding
LinkOut - more resources
Full Text Sources
Other Literature Sources
Research Materials
