

Safety and efficacy of combination of suberoylamilide hydroxyamic acid and mitomycin C in reducing pro-fibrotic changes in human corneal epithelial cells
- PMID: 33623133
- PMCID: PMC7902619
- DOI: 10.1038/s41598-021-83881-y
Safety and efficacy of combination of suberoylamilide hydroxyamic acid and mitomycin C in reducing pro-fibrotic changes in human corneal epithelial cells
Abstract
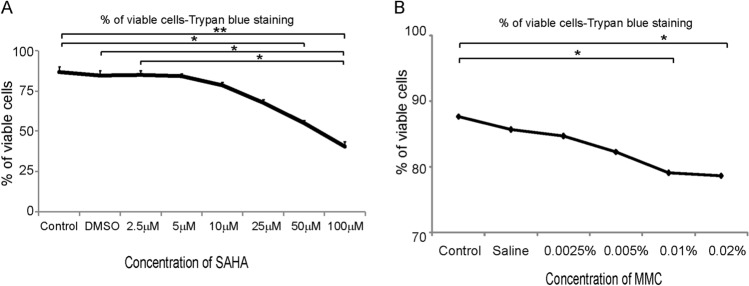
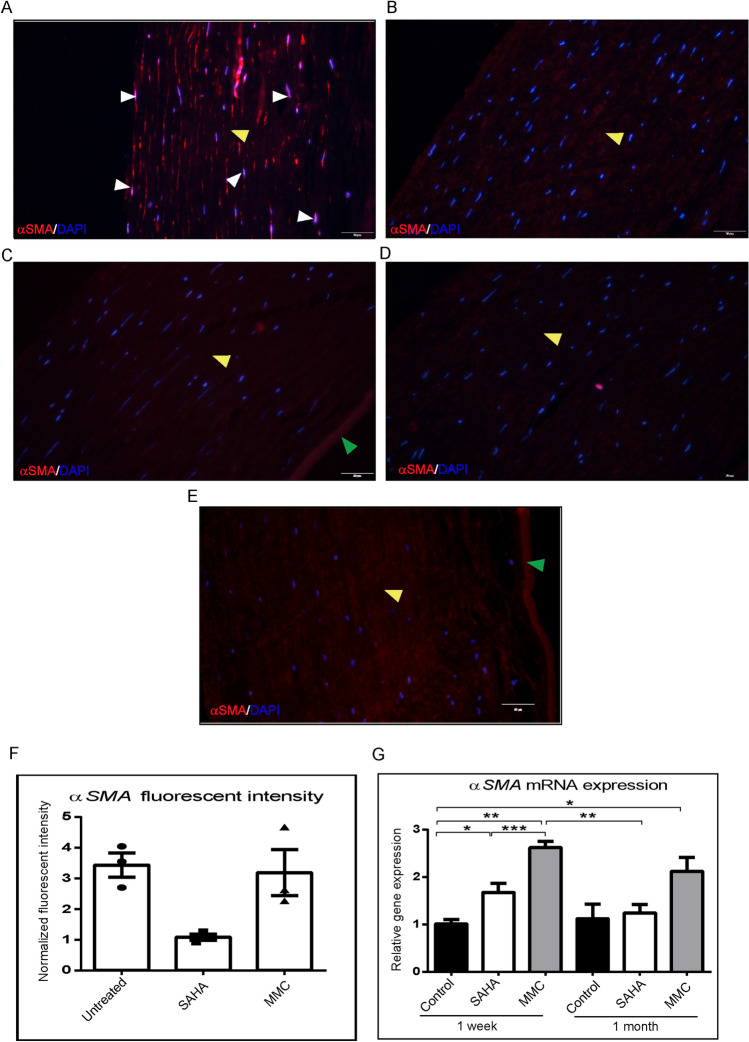
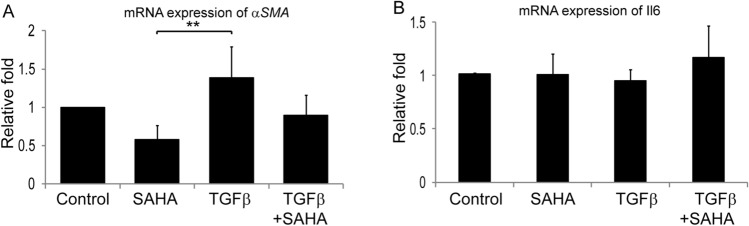
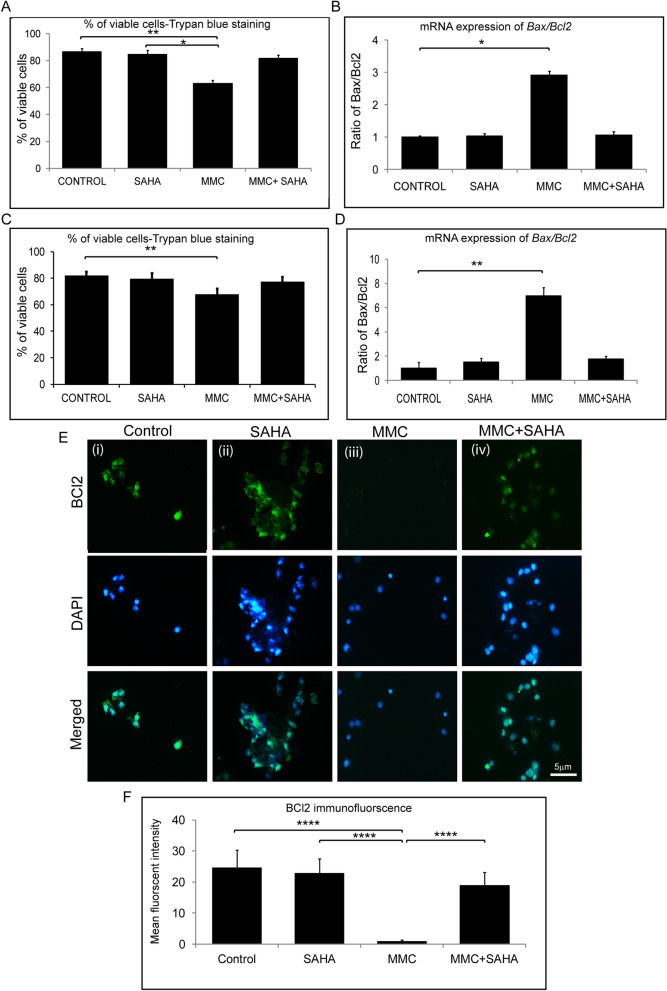
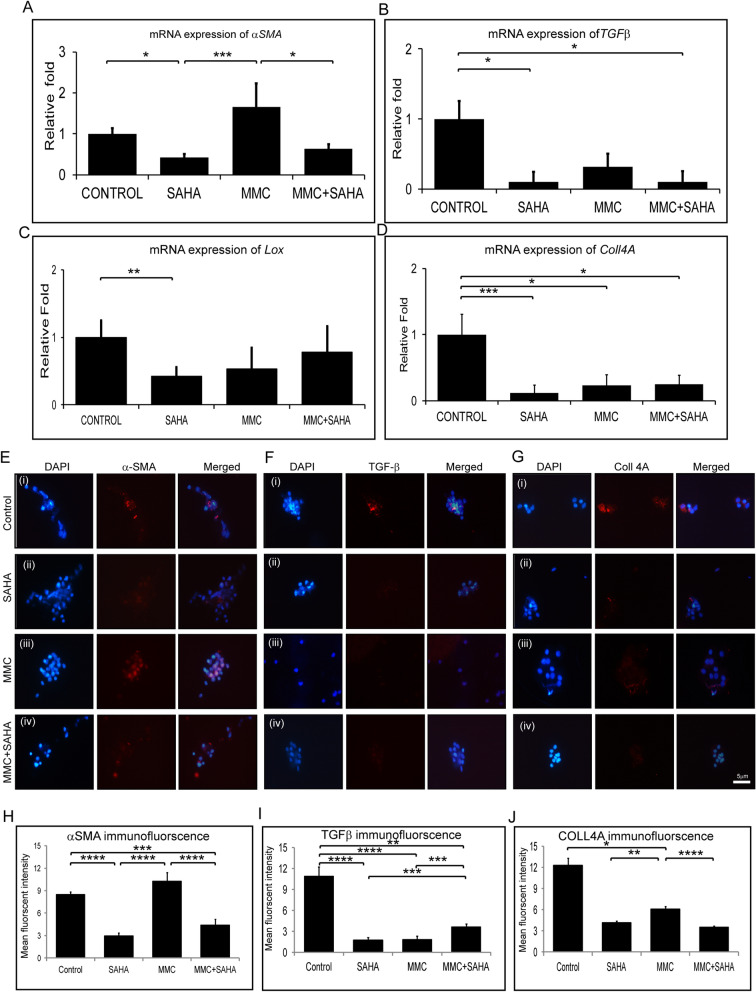
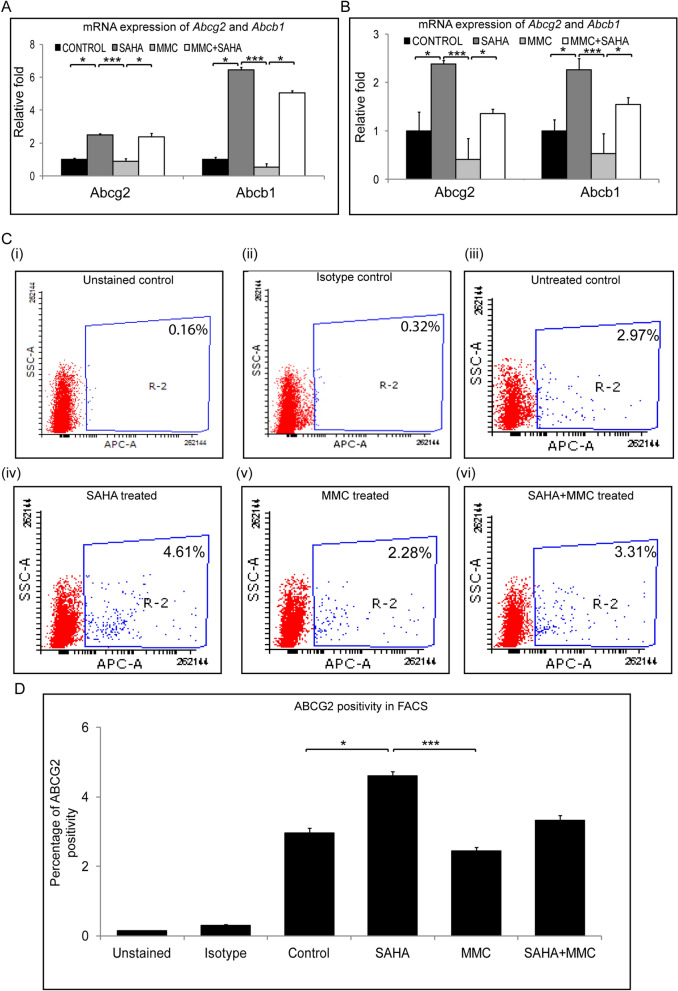
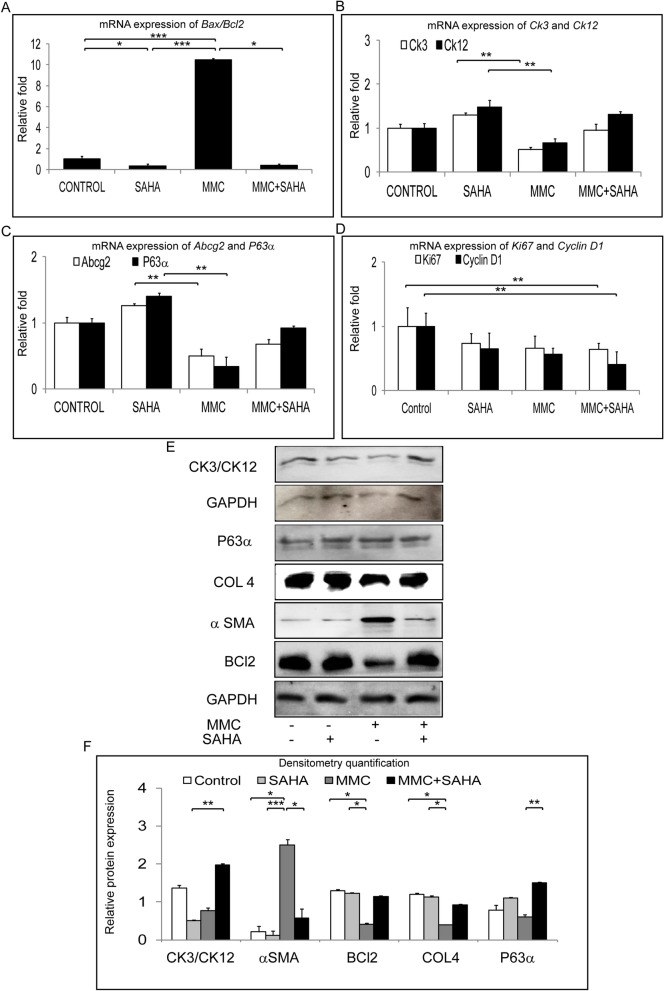
Corneal haze post refractive surgery is prevented by mitomycin c (MMC) treatment though it can lead to corneal endothelial damage, persistent epithelial defects and necrosis of cells. Suberanilohydroxamic acid (SAHA) however has been proposed to prevent corneal haze without any adverse effects. For clinical application we have investigated the short and long term outcome of cells exposed to SAHA. Human donor cornea, cultured limbal epithelial cells, corneal rims and lenticules were incubated with SAHA and MMC. The cells/tissue was then analyzed by RT-qPCR, immunofluorescence and western blot for markers of apoptosis and fibrosis. The results reveal that short term exposure of SAHA and SAHA + MMC reduced apoptosis levels and increased αSMA expression compared to those treated with MMC. Epithelial cells derived from cultured corneal rim that were incubated with the MMC, SAHA or MMC + SAHA revealed enhanced apoptosis, reduced levels of CK3/CK12, ∆NP63 and COL4A compared to other treatments. In SAHA treated lenticules TGFβ induced fibrosis was reduced. The results imply that MMC treatment for corneal haze has both short term and long term adverse effects on cells and the cellular properties. However, a combinatorial treatment of SAHA + MMC prevents expression of corneal fibrotic markers without causing any adverse effect on cellular properties.
Conflict of interest statement
The authors declare no competing interests.
Figures
Similar articles
-
Efficacy and Safety Comparison Between Suberoylanilide Hydroxamic Acid and Mitomycin C in Reducing the Risk of Corneal Haze After PRK Treatment In Vivo.J Refract Surg. 2017 Dec 1;33(12):834-839. doi: 10.3928/1081597X-20170921-02. J Refract Surg. 2017. PMID: 29227512 Free PMC article.
-
The efficacy of co-treatment with suberoylanilide hydroxamic acid and mitomycin C on corneal scarring after therapeutic keratectomy: an animal study.Curr Eye Res. 2014 Apr;39(4):348-58. doi: 10.3109/02713683.2013.859272. Epub 2014 Jan 8. Curr Eye Res. 2014. PMID: 24401036
-
Mitomycin C induces apoptosis in cultured corneal fibroblasts derived from type II granular corneal dystrophy corneas.Mol Vis. 2008 Jun 30;14:1222-8. Mol Vis. 2008. PMID: 18615204 Free PMC article.
-
Biological effects of mitomycin C on late corneal haze stromal fibrosis following PRK.Exp Eye Res. 2020 Nov;200:108218. doi: 10.1016/j.exer.2020.108218. Epub 2020 Sep 6. Exp Eye Res. 2020. PMID: 32905844 Free PMC article. Review.
-
A Critical Overview of the Biological Effects of Mitomycin C Application on the Cornea Following Refractive Surgery.Adv Ther. 2019 Apr;36(4):786-797. doi: 10.1007/s12325-019-00905-w. Epub 2019 Mar 11. Adv Ther. 2019. PMID: 30859502 Free PMC article. Review.
Cited by
-
Integrated transcriptome and proteome analysis identifies keratins as key regulators of corneal scarring in a murine model.Comput Struct Biotechnol J. 2025 May 27;27:2264-2274. doi: 10.1016/j.csbj.2025.05.042. eCollection 2025. Comput Struct Biotechnol J. 2025. PMID: 40520593 Free PMC article.
-
Stability of refractive outcomes after hyperopic LASIK with and without Mitomycin C application: a randomized controlled trial.Sci Rep. 2025 Jan 6;15(1):961. doi: 10.1038/s41598-024-83757-x. Sci Rep. 2025. PMID: 39762309 Free PMC article. Clinical Trial.
-
Corneal fibrosis abrogation by a localized AAV-mediated inhibitor of differentiation 3 (Id3) gene therapy in rabbit eyes in vivo.Mol Ther. 2022 Oct 5;30(10):3257-3269. doi: 10.1016/j.ymthe.2022.06.018. Epub 2022 Jul 2. Mol Ther. 2022. PMID: 35780298 Free PMC article.
-
Corneal stromal repair and regeneration.Prog Retin Eye Res. 2022 Nov;91:101090. doi: 10.1016/j.preteyeres.2022.101090. Epub 2022 May 29. Prog Retin Eye Res. 2022. PMID: 35649962 Free PMC article. Review.
References
Publication types
MeSH terms
Substances
LinkOut - more resources
Full Text Sources
Other Literature Sources
