

Dysregulated gene-associated biomarkers for Alzheimer's disease and aging
- PMID: 33623715
- PMCID: PMC7885957
- DOI: 10.1515/tnsci-2021-0009
Dysregulated gene-associated biomarkers for Alzheimer's disease and aging
Abstract
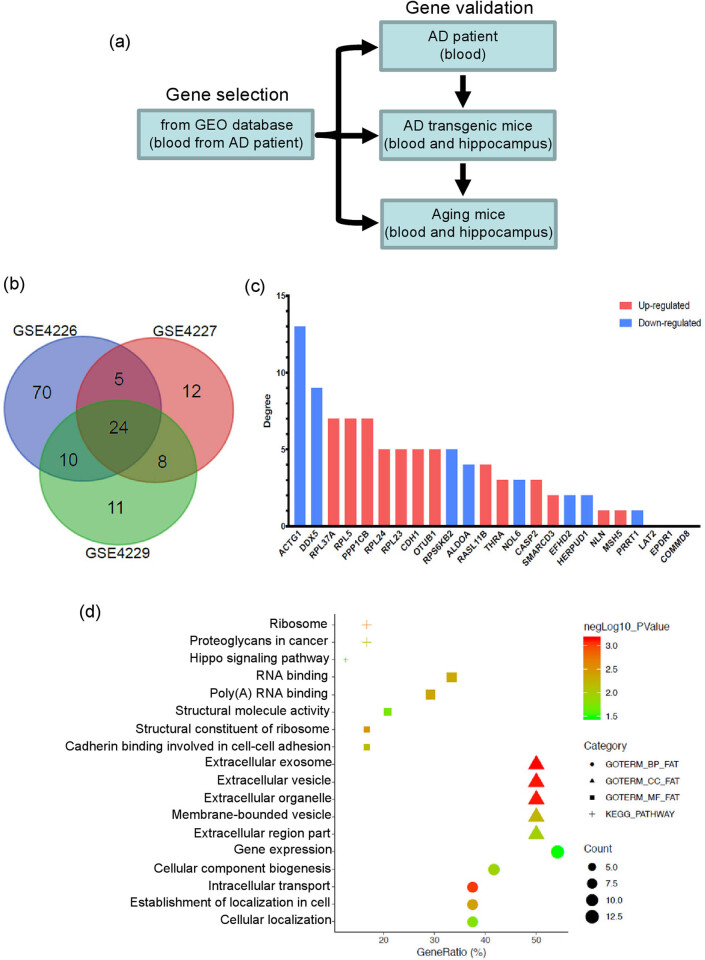
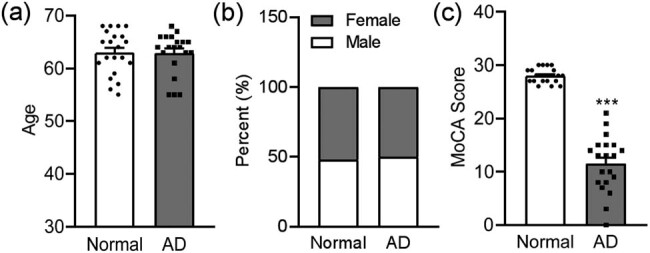
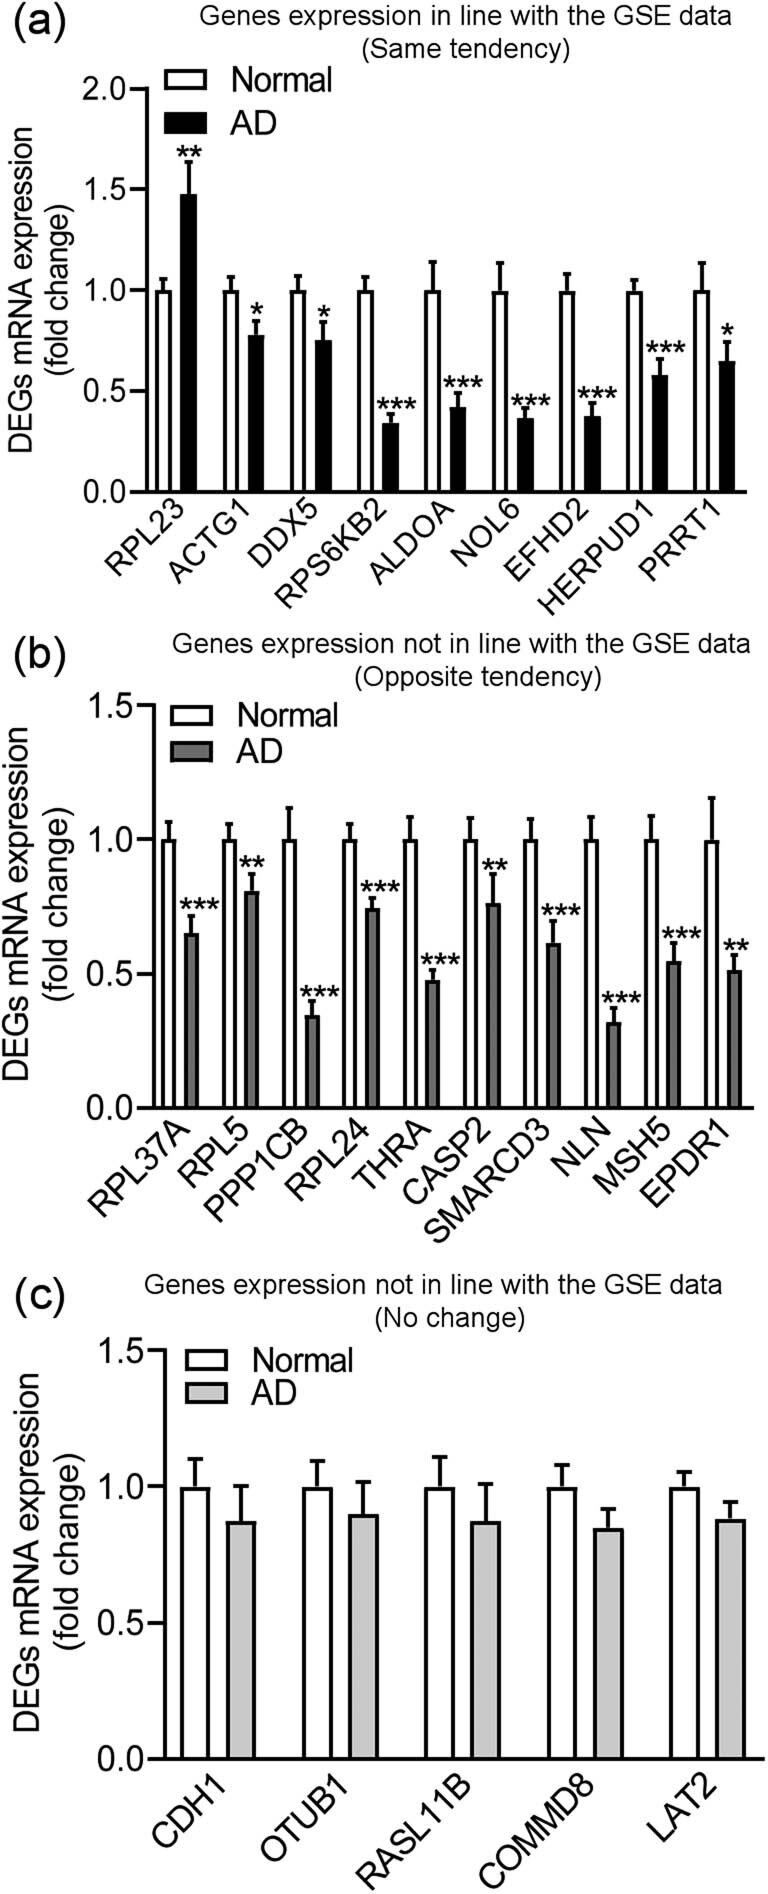
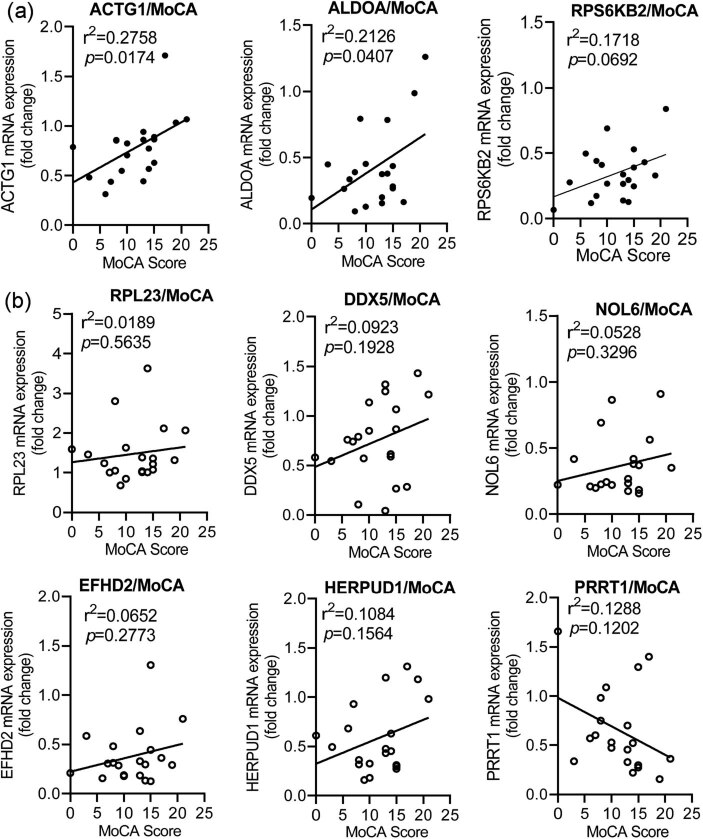
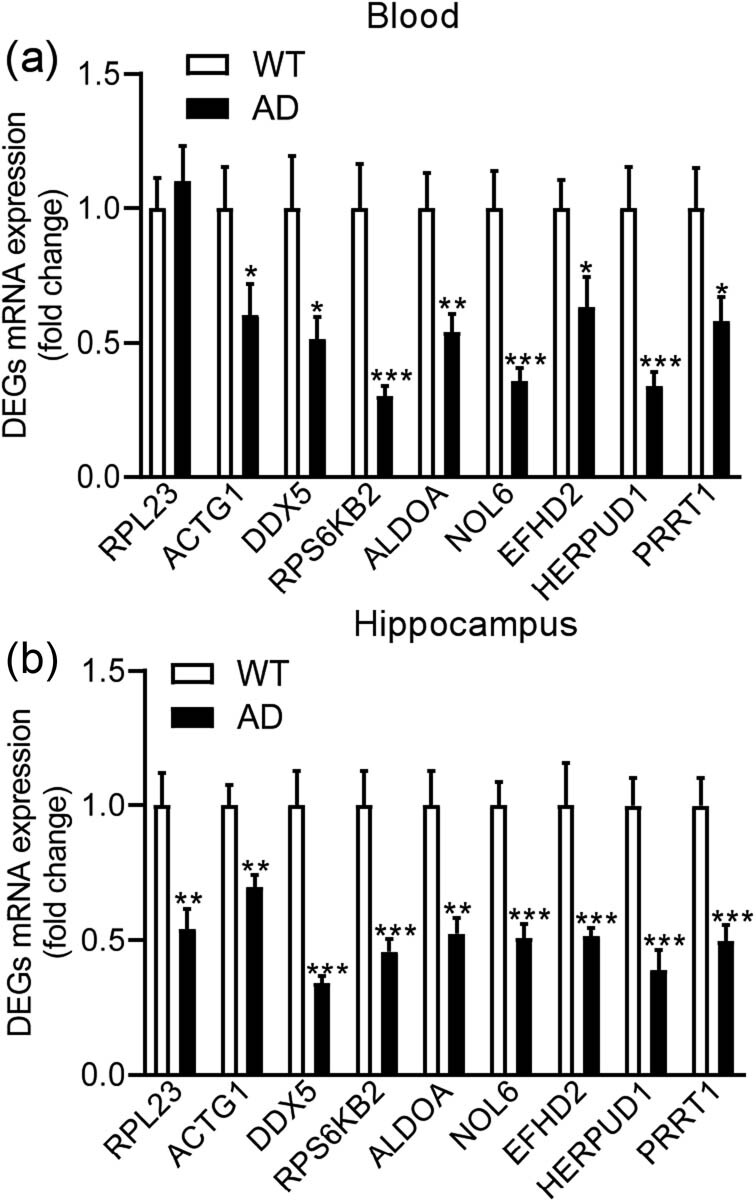
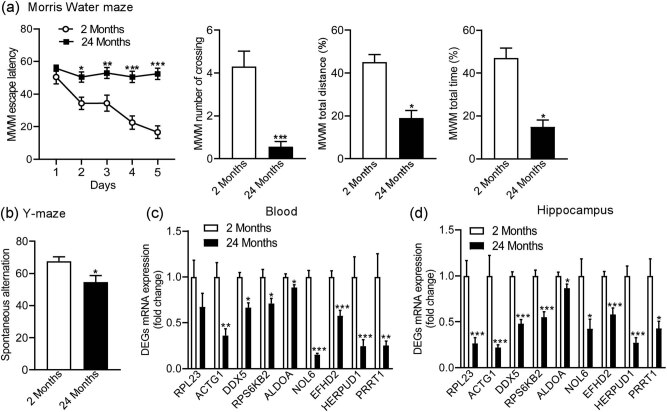
Alzheimer's disease (AD), the most common type of dementia, is a neurodegenerative disorder with a hidden onset, including difficult early detection and diagnosis. Nevertheless, the new crucial biomarkers for the diagnosis and pathogenesis of AD need to be explored further. Here, the common differentially expressed genes (DEGs) were identified through a comprehensive analysis of gene expression profiles from the Gene Expression Omnibus (GEO) database. Furthermore, Gene Ontology and Kyoto Encyclopedia of Genes and Genomes pathway analyses revealed that these DEGs were mainly associated with biological processes, cellular components, and molecular functions, which are involved in multiple cellular functions. Next, we found that 9 of the 24 genes showed the same regulatory changes in the blood of patients with AD compared to those in the GEO database, and 2 of the 24 genes showed a significant correlation with Montreal Cognitive Assessment scores. Finally, we determined that mice with AD and elderly mice had the same regulatory changes in the identified DEGs in both the blood and hippocampus. Our study identified several potential core biomarkers of AD and aging, which could contribute to the early detection, differential diagnosis, treatment, and pathological analysis of AD.
Keywords: Alzheimer’s disease; aging; blood; differentially expressed genes; hippocampus.
© 2021 Min Li et al., published by De Gruyter.
Conflict of interest statement
Conflict of interest: The authors state no conflict of interest.
Figures
Similar articles
-
Immune abnormalities and differential gene expression in the hippocampus and peripheral blood of patients with Alzheimer's disease.Ann Transl Med. 2022 Jan;10(2):29. doi: 10.21037/atm-21-4974. Ann Transl Med. 2022. PMID: 35282083 Free PMC article.
-
Untangling the complex mechanisms associated with Alzheimer's disease in elderly patients using high-throughput RNA sequencing data and next-generation knowledge discovery methods: Focus on potential gene signatures and drugs for dementia.Heliyon. 2024 Dec 18;11(1):e41266. doi: 10.1016/j.heliyon.2024.e41266. eCollection 2025 Jan 15. Heliyon. 2024. PMID: 39834440 Free PMC article.
-
Identification of hub genes associated with cognition in the hippocampus of Alzheimer's Disease.Bioengineered. 2021 Dec;12(2):9598-9609. doi: 10.1080/21655979.2021.1999549. Bioengineered. 2021. PMID: 34719328 Free PMC article.
-
Plasma neuronal exosomes serve as biomarkers of cognitive impairment in HIV infection and Alzheimer's disease.J Neurovirol. 2019 Oct;25(5):702-709. doi: 10.1007/s13365-018-0695-4. Epub 2019 Jan 4. J Neurovirol. 2019. PMID: 30610738 Free PMC article. Review.
-
NIA-AA Research Framework: Toward a biological definition of Alzheimer's disease.Alzheimers Dement. 2018 Apr;14(4):535-562. doi: 10.1016/j.jalz.2018.02.018. Alzheimers Dement. 2018. PMID: 29653606 Free PMC article. Review.
Cited by
-
Cognitively healthy centenarians are genetically protected against Alzheimer's disease.Alzheimers Dement. 2024 Jun;20(6):3864-3875. doi: 10.1002/alz.13810. Epub 2024 Apr 18. Alzheimers Dement. 2024. PMID: 38634500 Free PMC article.
-
Identification of 16 novel Alzheimer's disease susceptibility loci using multi-ancestry meta-analyses of clinical Alzheimer's disease and AD-by-proxy cases from four whole genome sequencing datasets.medRxiv [Preprint]. 2024 Sep 12:2024.09.11.24313439. doi: 10.1101/2024.09.11.24313439. medRxiv. 2024. PMID: 39314934 Free PMC article. Preprint.
-
Loss of SynDIG4/PRRT1 alters distribution of AMPA receptors in Rab4- and Rab11-positive endosomes and impairs basal AMPA receptor recycling.Front Pharmacol. 2025 May 21;16:1568908. doi: 10.3389/fphar.2025.1568908. eCollection 2025. Front Pharmacol. 2025. PMID: 40469985 Free PMC article.
-
Cryptotanshinone ameliorates CUS-induced depressive-like behaviors in mice.Transl Neurosci. 2021 Nov 30;12(1):469-481. doi: 10.1515/tnsci-2020-0198. eCollection 2021 Jan 1. Transl Neurosci. 2021. PMID: 34900345 Free PMC article.
-
Chlamydia pneumoniae in Alzheimer's disease pathology.Front Neurosci. 2024 May 6;18:1393293. doi: 10.3389/fnins.2024.1393293. eCollection 2024. Front Neurosci. 2024. PMID: 38770241 Free PMC article. Review.
References
-
- Alzheimer’s Association. 2020 Alzheimer’s disease facts and figures. Alzheimers Dement. 2020 Mar;16(3):391–460.
- Alzheimer’s Association. 2020 Alzheimer’s disease facts and figures. Alzheimers Dement. 2020 Mar;16(3):391–460.
-
- Kurz A, Perneczky R. Novel insights for the treatment of Alzheimer’s disease. Prog Neuropsychopharmacol Biol Psychiatry. 2011 Mar;35(2):373–9. - PubMed
- Kurz A, Perneczky R. Novel insights for the treatment of Alzheimer’s disease. Prog Neuropsychopharmacol Biol Psychiatry. 2011 Mar;35(2):373–9. - PubMed
-
- Cummings JL, Morstorf T, Zhong K. Alzheimer’s disease drug-development pipeline: few candidates, frequent failures. Alzheimers Res Ther. 2014 Jul;6(4):37. - PMC - PubMed
- Cummings JL, Morstorf T, Zhong K. Alzheimer’s disease drug-development pipeline: few candidates, frequent failures. Alzheimers Res Ther. 2014 Jul;6(4):37. - PMC - PubMed
-
- Giri M, Zhang M, Lü Y. Genes associated with Alzheimer’s disease: an overview and current status. Clin Interv Aging. 2016 May;11:665–81. - PMC - PubMed
- Giri M, Zhang M, Lü Y. Genes associated with Alzheimer’s disease: an overview and current status. Clin Interv Aging. 2016 May;11:665–81. - PMC - PubMed
LinkOut - more resources
Full Text Sources
Other Literature Sources
Molecular Biology Databases