

Selection and Validation of Reference Genes for RT-qPCR Analysis in Spinacia oleracea under Abiotic Stress
- PMID: 33623781
- PMCID: PMC7875621
- DOI: 10.1155/2021/4853632
Selection and Validation of Reference Genes for RT-qPCR Analysis in Spinacia oleracea under Abiotic Stress
Abstract
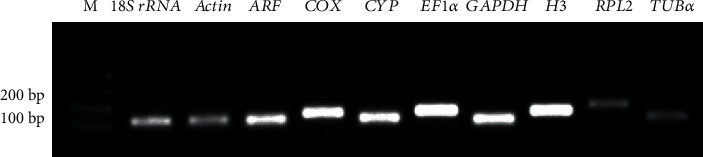
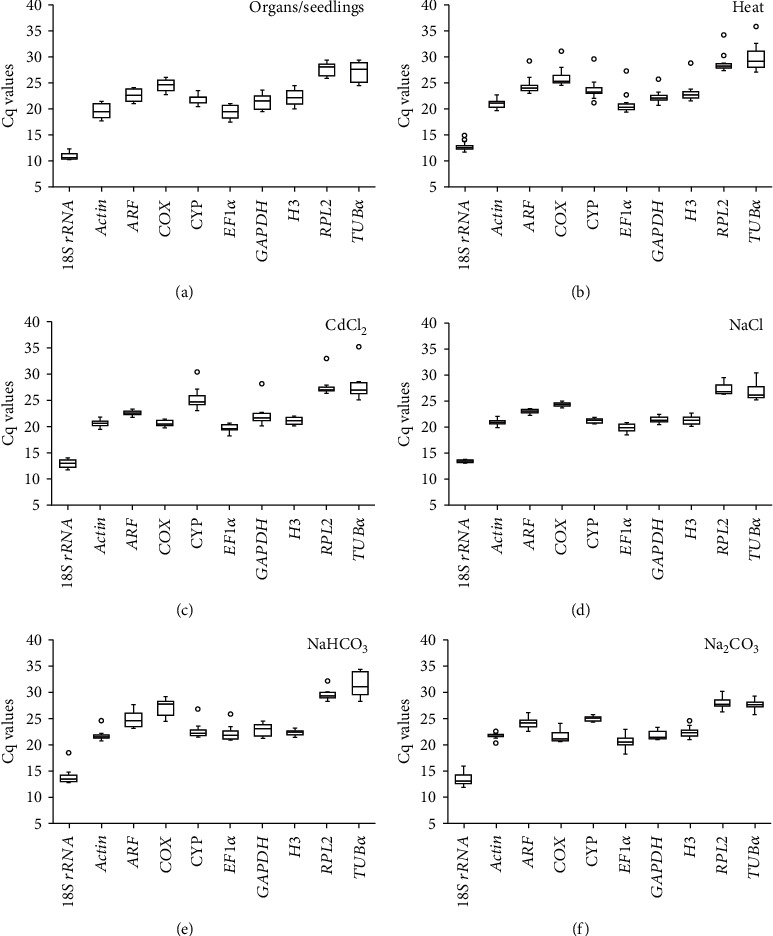
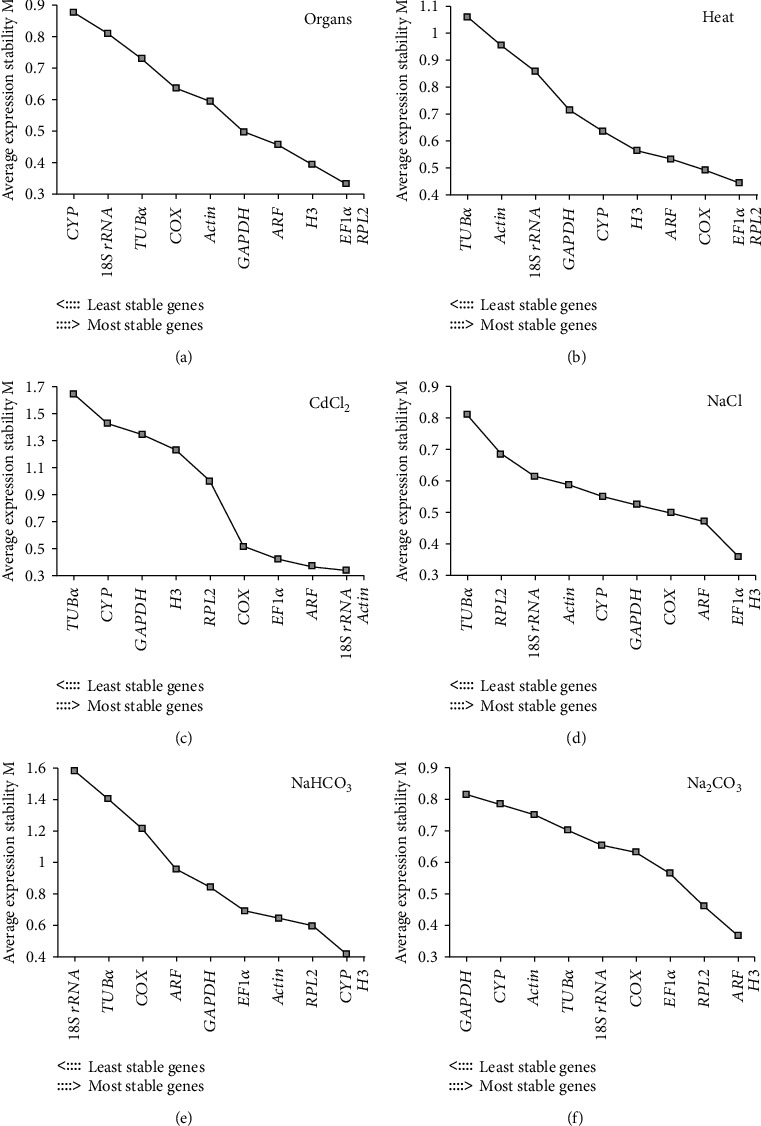
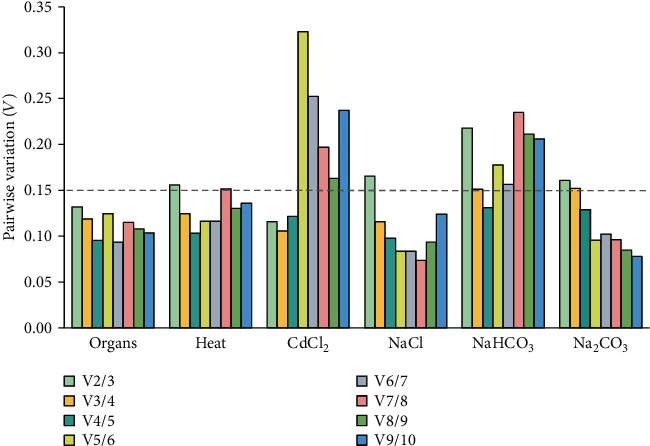
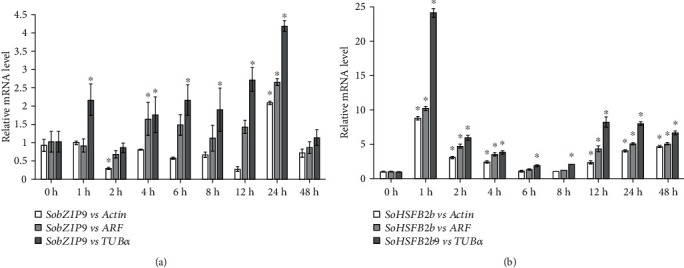
Reverse transcription quantitative real-time polymerase chain reaction (RT-qPCR) is an accurate and convenient method for mRNA quantification. Selection of optimal reference gene(s) is an important step in RT-qPCR experiments. However, the stability of housekeeping genes in spinach (Spinacia oleracea) under various abiotic stresses is unclear. Evaluating the stability of candidate genes and determining the optimal gene(s) for normalization of gene expression in spinach are necessary to investigate the gene expression patterns during development and stress response. In this study, ten housekeeping genes, 18S ribosomal RNA (18S rRNA), actin, ADP ribosylation factor (ARF), cytochrome c oxidase subunit 5C (COX), cyclophilin (CYP), elongation factor 1-alpha (EF1α), glyceraldehyde-3-phosphate dehydrogenase (GAPDH), histone H3 (H3), 50S ribosomal protein L2 (RPL2), and tubulin alpha chain (TUBα) from spinach, were selected as candidates in roots, stems, leaves, flowers, and seedlings in response to high temperature, CdCl2, NaCl, NaHCO3, and Na2CO3 stresses. The expression of these genes was quantified by RT-qPCR and evaluated by NormFinder, BestKeeper, and geNorm. 18S rRNA, actin, ARF, COX, CYP, EF1α, GAPDH, H3, and RPL2 were detected as optimal reference genes for gene expression analysis of different organs and stress responses. The results were further confirmed by the expression pattern normalized with different reference genes of two heat-responsive genes. Here, we optimized the detection method of the gene expression pattern in spinach. Our results provide the optimal candidate reference genes which were crucial for RT-qPCR analysis.
Copyright © 2021 Hao Xie et al.
Conflict of interest statement
The authors declare no conflict of interest.
Figures
Similar articles
-
Defining reference genes for qPCR normalization to study biotic and abiotic stress responses in Vigna mungo.Plant Cell Rep. 2013 Oct;32(10):1647-58. doi: 10.1007/s00299-013-1478-2. Epub 2013 Jul 19. Plant Cell Rep. 2013. PMID: 23868569
-
Selection and validation of reference genes in alfalfa based on transcriptome sequence data.Sci Rep. 2025 Feb 21;15(1):6324. doi: 10.1038/s41598-025-90664-2. Sci Rep. 2025. PMID: 39984589 Free PMC article.
-
Identification and validation of stable reference genes for RT-qPCR analyses of Kobresia littledalei seedlings.BMC Plant Biol. 2024 May 11;24(1):389. doi: 10.1186/s12870-024-04924-w. BMC Plant Biol. 2024. PMID: 38730341 Free PMC article.
-
Gene expression studies of reference genes for quantitative real-time PCR: an overview in insects.Biotechnol Lett. 2018 Feb;40(2):227-236. doi: 10.1007/s10529-017-2465-4. Epub 2017 Nov 9. Biotechnol Lett. 2018. PMID: 29124515 Review.
-
Current Practices for Reference Gene Selection in RT-qPCR of Aspergillus: Outlook and Recommendations for the Future.Genes (Basel). 2021 Jun 24;12(7):960. doi: 10.3390/genes12070960. Genes (Basel). 2021. PMID: 34202507 Free PMC article. Review.
Cited by
-
Transcriptome-guided selection of stable reference genes for expression analysis in spinach.Sci Rep. 2024 Sep 27;14(1):22113. doi: 10.1038/s41598-024-73444-2. Sci Rep. 2024. PMID: 39333266 Free PMC article.
-
Comprehensive transcriptomic analysis of myostatin-knockout pigs: insights into muscle growth and lipid metabolism.Transgenic Res. 2025 Feb 20;34(1):12. doi: 10.1007/s11248-025-00431-2. Transgenic Res. 2025. PMID: 39979478
-
Identification and validation of reference genes in vetiver (Chrysopogon zizanioides) root transcriptome.Physiol Mol Biol Plants. 2023 May;29(5):613-627. doi: 10.1007/s12298-023-01315-7. Epub 2023 May 25. Physiol Mol Biol Plants. 2023. PMID: 37363421 Free PMC article.
-
Selection of Suitable Reference Genes for RT-qPCR Gene Expression Analysis in Centipedegrass under Different Abiotic Stress.Genes (Basel). 2023 Sep 26;14(10):1874. doi: 10.3390/genes14101874. Genes (Basel). 2023. PMID: 37895223 Free PMC article.
-
Identification of Reference Genes for RT-qPCR Analysis in Gleditsia microphylla under Abiotic Stress and Hormone Treatment.Genes (Basel). 2022 Jul 10;13(7):1227. doi: 10.3390/genes13071227. Genes (Basel). 2022. PMID: 35886010 Free PMC article.
References
MeSH terms
Substances
LinkOut - more resources
Full Text Sources
Other Literature Sources
Research Materials
