

Cardiovascular disease risk prediction for people with type 2 diabetes in a population-based cohort and in electronic health record data
- PMID: 33623893
- PMCID: PMC7886535
- DOI: 10.1093/jamiaopen/ooaa059
Cardiovascular disease risk prediction for people with type 2 diabetes in a population-based cohort and in electronic health record data
Abstract
Objective: Electronic health records (EHRs) have become a common data source for clinical risk prediction, offering large sample sizes and frequently sampled metrics. There may be notable differences between hospital-based EHR and traditional cohort samples: EHR data often are not population-representative random samples, even for particular diseases, as they tend to be sicker with higher healthcare utilization, while cohort studies often sample healthier subjects who typically are more likely to participate. We investigate heterogeneities between EHR- and cohort-based inferences including incidence rates, risk factor identifications/quantifications, and absolute risks.
Materials and methods: This is a retrospective cohort study of older patients with type 2 diabetes using EHR from New York University Langone Health ambulatory care (NYULH-EHR, years 2009-2017) and from the Health and Retirement Survey (HRS, 1995-2014) to study subsequent cardiovascular disease (CVD) risks. We used the same eligibility criteria, outcome definitions, and demographic covariates/biomarkers in both datasets. We compared subsequent CVD incidence rates, hazard ratios (HRs) of risk factors, and discrimination/calibration performances of CVD risk scores.
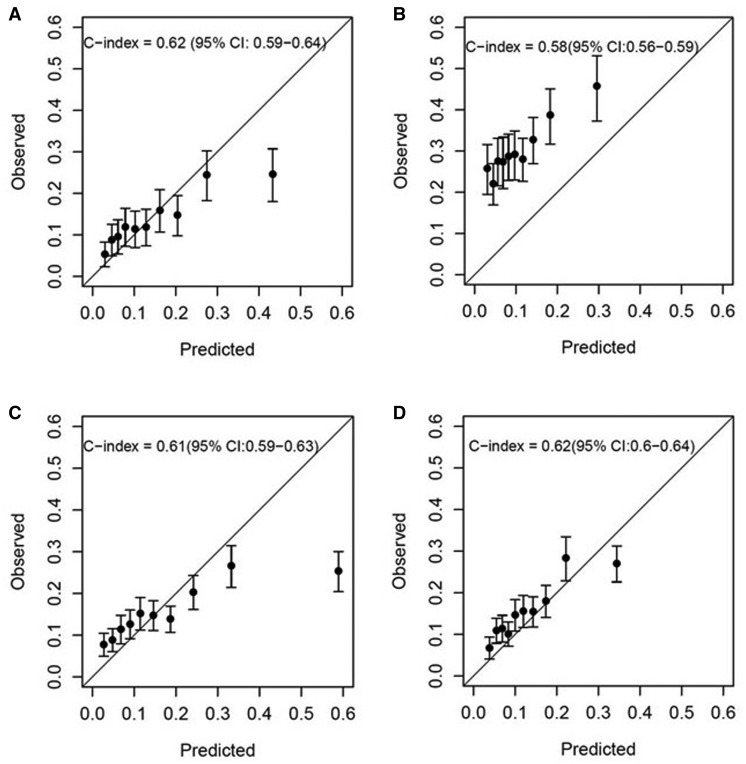
Results: The estimated subsequent total CVD incidence rate was 37.5 and 90.6 per 1000 person-years since T2DM onset in HRS and NYULH-EHR respectively. HR estimates were comparable between the datasets for most demographic covariates/biomarkers. Common CVD risk scores underestimated observed total CVD risks in NYULH-EHR.
Discussion and conclusion: EHR-estimated HRs of demographic and major clinical risk factors for CVD were mostly consistent with the estimates from a national cohort, despite high incidences and absolute risks of total CVD outcome in the EHR samples.
Keywords: cardiovascular disease; cohort analysis; electronic health records; risk factors; type 2 diabetes mellitus.
© The Author(s) 2020. Published by Oxford University Press on behalf of the American Medical Informatics Association.
Figures

Similar articles
-
Implementation of a Behavioral Economics Electronic Health Record (BE-EHR) Module to Reduce Overtreatment of Diabetes in Older Adults.J Gen Intern Med. 2020 Nov;35(11):3254-3261. doi: 10.1007/s11606-020-06119-z. Epub 2020 Sep 3. J Gen Intern Med. 2020. PMID: 32885374 Free PMC article.
-
Contemporary Burden of Cardiovascular Disease in Pregnancy: Insights from a Real-World Pregnancy Electronic Health Record Cohort.medRxiv [Preprint]. 2025 Jan 29:2025.01.28.25320930. doi: 10.1101/2025.01.28.25320930. medRxiv. 2025. PMID: 39974091 Free PMC article. Preprint.
-
Exploring electronic health records as a population health surveillance tool of cardiovascular disease risk factors.Popul Health Manag. 2015 Apr;18(2):79-85. doi: 10.1089/pop.2014.0058. Epub 2014 Oct 7. Popul Health Manag. 2015. PMID: 25290223
-
Adult patient access to electronic health records.Cochrane Database Syst Rev. 2021 Feb 26;2(2):CD012707. doi: 10.1002/14651858.CD012707.pub2. Cochrane Database Syst Rev. 2021. PMID: 33634854 Free PMC article.
-
Which elderly patients should be considered for anti-hypertensive treatment? An evidence-based approach.J Hum Hypertens. 1998 Sep;12(9):607-13. doi: 10.1038/sj.jhh.1000674. J Hum Hypertens. 1998. PMID: 9783489 Review.
Cited by
-
Willingness-to-pay for cancer treatment and outcome: a systematic review.Eur J Health Econ. 2022 Aug;23(6):1037-1057. doi: 10.1007/s10198-021-01407-9. Epub 2021 Dec 2. Eur J Health Econ. 2022. PMID: 34853930
-
Evaluation of available risk scores to predict multiple cardiovascular complications for patients with type 2 diabetes mellitus using electronic health records.Comput Methods Programs Biomed Update. 2023;3:100087. doi: 10.1016/j.cmpbup.2022.100087. Epub 2022 Dec 19. Comput Methods Programs Biomed Update. 2023. PMID: 37332899 Free PMC article.
-
Developing a Data Quality Standard Primer for Cardiovascular Risk Assessment from Electronic Health Record Data Using the DataGauge Process.AMIA Annu Symp Proc. 2022 Feb 21;2021:388-397. eCollection 2021. AMIA Annu Symp Proc. 2022. PMID: 35308992 Free PMC article.
-
Precision prognostics for cardiovascular disease in Type 2 diabetes: a systematic review and meta-analysis.Commun Med (Lond). 2024 Jan 22;4(1):11. doi: 10.1038/s43856-023-00429-z. Commun Med (Lond). 2024. PMID: 38253823 Free PMC article.
References
-
- Sidebottom AC, Johnson PJ, VanWormer JJ, Sillah A, Winden TJ, Boucher JL.. Exploring electronic health records as a population health surveillance tool of cardiovascular disease risk factors. Popul Health Manag 2015; 18 (2): 79–85. - PubMed
Grants and funding
LinkOut - more resources
Full Text Sources