

Utility of risk prediction models to detect atrial fibrillation in screened participants
- PMID: 33624100
- PMCID: PMC8651014
- DOI: 10.1093/eurjpc/zwaa082
Utility of risk prediction models to detect atrial fibrillation in screened participants
Abstract
Aims: Atrial fibrillation (AF) is associated with higher risk of stroke. While the prevalence of AF is low in the general population, risk prediction models might identify individuals for selective screening of AF. We aimed to systematically identify and compare the utility of established models to predict prevalent AF.
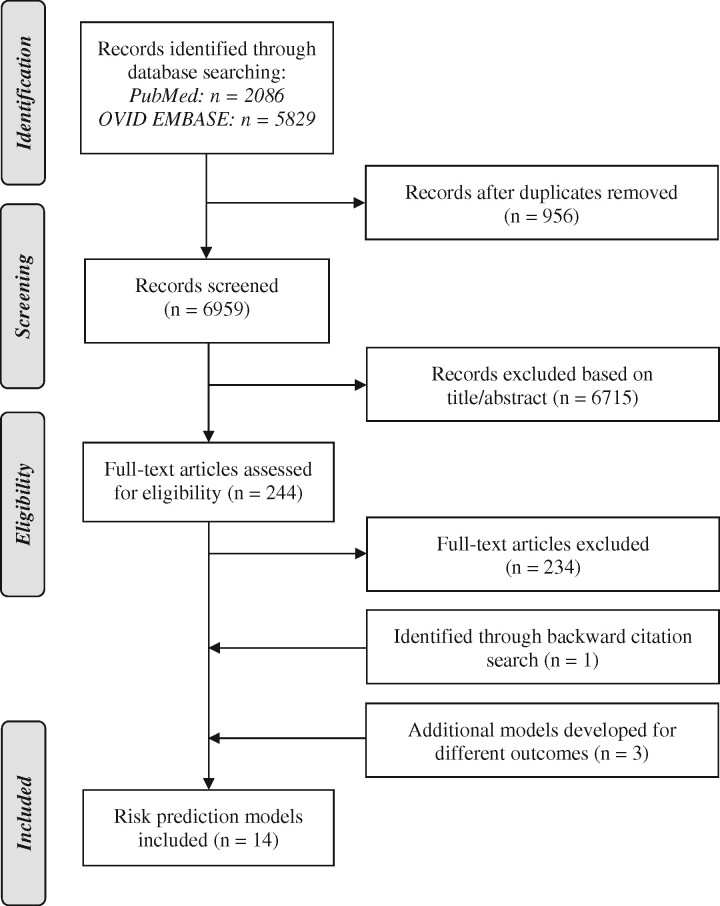
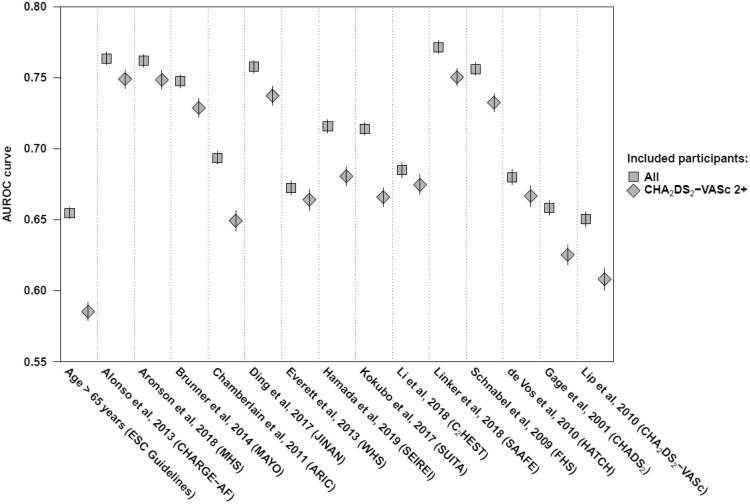
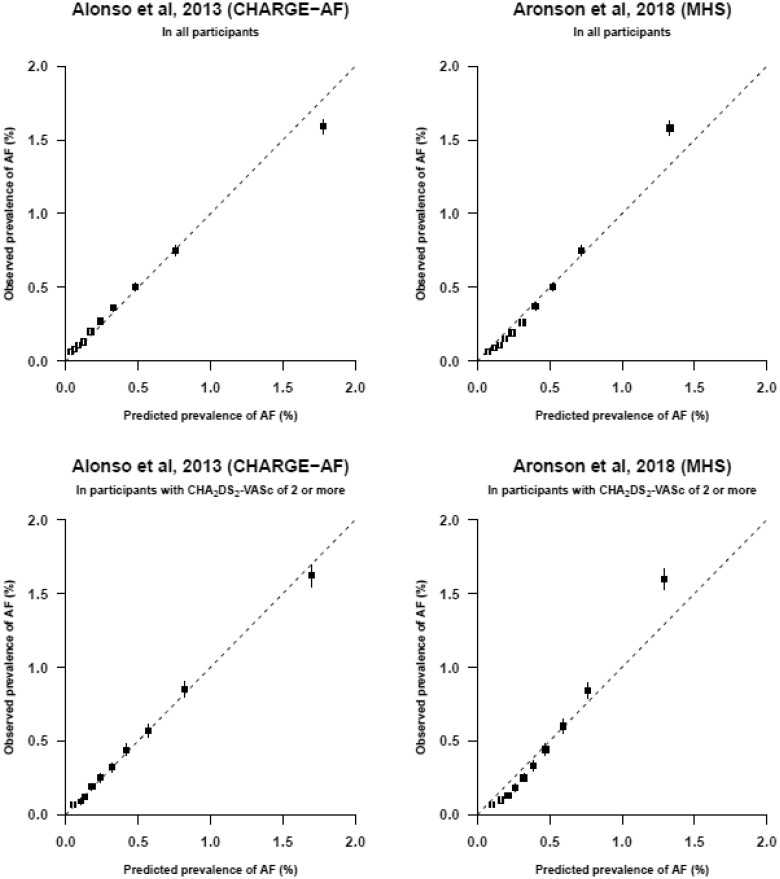
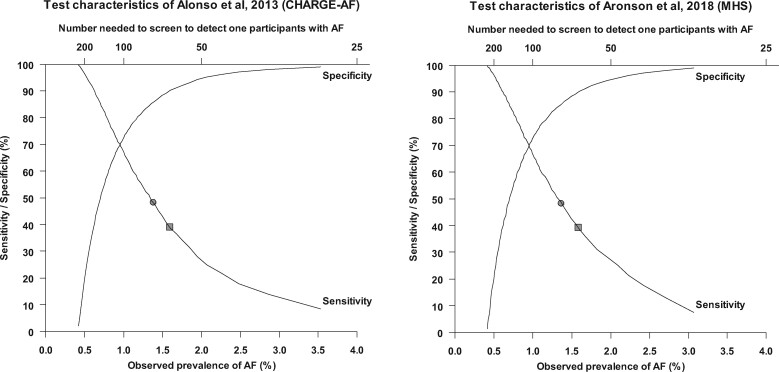
Methods and results: Systematic search of PubMed and EMBASE for risk prediction models for AF. We adapted established risk prediction models and assessed their predictive performance using data from 2.5M individuals who attended vascular screening clinics in the USA and the UK and in the subset of 1.2M individuals with CHA2DS2-VASc ≥2. We assessed discrimination using area under the receiver operating characteristic (AUROC) curves and agreement between observed and predicted cases using calibration plots. After screening 6959 studies, 14 risk prediction models were identified. In our cohort, 10 464 (0.41%) participants had AF. For discrimination, six prediction model had AUROC curves of 0.70 or above in all individuals and those with CHA2DS2-VASc ≥2. In these models, calibration plots showed very good concordance between predicted and observed risks of AF. The two models with the highest observed prevalence in the highest decile of predicted risk, CHARGE-AF and MHS, showed an observed prevalence of AF of 1.6% with a number needed to screen of 63. Selective screening of the 10% highest risk identified 39% of cases with AF.
Conclusion: Prediction models can reliably identify individuals at high risk of AF. The best performing models showed an almost fourfold higher prevalence of AF by selective screening of individuals in the highest decile of risk compared with systematic screening of all cases.
Registration: This systematic review was registered (PROSPERO CRD42019123847).
Keywords: Atrial fibrillation; External validation; Risk prediction models; Selective screening; Stroke.
© The Author(s) 2020. Published by Oxford University Press on behalf of the European Society of Cardiology.
Figures
Comment in
-
Risk prediction models in atrial fibrillation: from theory to practice.Eur J Prev Cardiol. 2021 May 22;28(6):584-585. doi: 10.1093/eurjpc/zwaa133. Eur J Prev Cardiol. 2021. PMID: 33580797 No abstract available.
References
-
- Chugh SS, Havmoeller R, Narayanan K, Singh D, Rienstra M, Benjamin EJ, Gillum RF, Kim Y-H, McAnulty JH, Zheng Z-J, Forouzanfar MH, Naghavi M, Mensah GA, Ezzati M, Murray CJL. Worldwide epidemiology of atrial fibrillation: a global burden of disease 2010 study. Circulation 2014;129:837–847. - PMC - PubMed
-
- Gómez-Outes A, Lagunar-Ruíz J, Terleira-Fernández AI, Calvo-Rojas G, Suárez-Gea ML, Vargas-Castrillón E. Causes of death in anticoagulated patients with atrial fibrillation. J Am Coll Cardiol 2016;68:2508–2521. - PubMed
-
- Wolf PA, Abbott RD, Kannel WB. Atrial fibrillation as an independent risk factor for stroke: the Framingham study. Stroke 1991;22:983–988. - PubMed
-
- Lip GY, Nieuwlaat R, Pisters R, Lane DA, Crijns HJ. Refining clinical risk stratification for predicting stroke and thromboembolism in atrial fibrillation using a novel risk factor-based approach: the Euro Heart Survey on atrial fibrillation. Chest 2010;137:263–272. - PubMed
-
- Hart RG, Pearce LA, Aguilar MI. Meta-analysis: antithrombotic therapy to prevent stroke in patients who have nonvalvular atrial fibrillation. Ann Intern Med 2007;146:857–867. - PubMed
