Sex Differences in Insulin Sensitivity are Related to Muscle Tissue Acylcarnitine But Not Subcellular Lipid Distribution
- PMID: 33624435
- PMCID: PMC7927726
- DOI: 10.1002/oby.23106
Sex Differences in Insulin Sensitivity are Related to Muscle Tissue Acylcarnitine But Not Subcellular Lipid Distribution
Abstract
Objective: Sex differences in insulin sensitivity are present throughout the life-span, with men having a higher prevalence of insulin resistance and diabetes compared with women. Differences in lean mass, fat mass, and fat distribution-particularly ectopic fat-have all been postulated to contribute to the sexual dimorphism in diabetes risk. Emerging data suggest ectopic lipid composition and subcellular localization are most relevant; however, it is not known whether they explain sex differences in obesity-induced insulin resistance.
Methods: To address this gap, this study evaluated insulin sensitivity and subcellular localization of intramuscular triacylglycerol, diacylglycerol, and sphingolipids as well as muscle acylcarnitines and serum lipidomics in people with obesity.
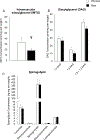
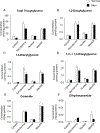
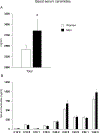
Results: Insulin sensitivity was significantly lower in men (P < 0.05); however, no sex differences were found in localization of intramuscular triacylglycerol, diacylglycerol, or sphingolipids in skeletal muscle. In contrast, men had higher total muscle acylcarnitine (P < 0.05) and long-chain muscle acylcarnitine (P < 0.05), which were related to lower insulin sensitivity (r = -0.42, P < 0.05). Men also displayed higher serum ceramide (P = 0.05) and lysophosphatidylcholine (P < 0.01).
Conclusions: These data reveal novel sex-specific associations between lipid species involved in the coupling of mitochondrial fatty acid transport, β-oxidation, and tricarboxylic acid cycle flux that may provide therapeutic targets to improve insulin sensitivity.
© 2021 The Obesity Society.
Conflict of interest statement
DECLARATION OF INTEREST
The authors declare no competing interests.
Figures


Similar articles
-
Intracellular localization of diacylglycerols and sphingolipids influences insulin sensitivity and mitochondrial function in human skeletal muscle.JCI Insight. 2018 Feb 8;3(3):e96805. doi: 10.1172/jci.insight.96805. eCollection 2018 Feb 8. JCI Insight. 2018. PMID: 29415895 Free PMC article. Clinical Trial.
-
Acylcarnitines as markers of exercise-associated fuel partitioning, xenometabolism, and potential signals to muscle afferent neurons.Exp Physiol. 2017 Jan 1;102(1):48-69. doi: 10.1113/EP086019. Epub 2016 Dec 12. Exp Physiol. 2017. PMID: 27730694 Free PMC article.
-
Plasma acylcarnitine profiling indicates increased fatty acid oxidation relative to tricarboxylic acid cycle capacity in young, healthy low birth weight men.Physiol Rep. 2016 Oct;4(19):e12977. doi: 10.14814/phy2.12977. Physiol Rep. 2016. PMID: 27694528 Free PMC article.
-
Skeletal Muscle Nucleo-Mitochondrial Crosstalk in Obesity and Type 2 Diabetes.Int J Mol Sci. 2017 Apr 14;18(4):831. doi: 10.3390/ijms18040831. Int J Mol Sci. 2017. PMID: 28420087 Free PMC article. Review.
-
Intramuscular lipid metabolism, insulin action, and obesity.IUBMB Life. 2009 Jan;61(1):47-55. doi: 10.1002/iub.142. IUBMB Life. 2009. PMID: 18839419 Free PMC article. Review.
Cited by
-
Plasma Citrate Levels Are Associated with an Increased Risk of Cardiovascular Mortality in Patients with Type 2 Diabetes (Zodiac-64).J Clin Med. 2023 Oct 22;12(20):6670. doi: 10.3390/jcm12206670. J Clin Med. 2023. PMID: 37892807 Free PMC article.
-
Distinct dynamic regulation of pectoralis muscle metabolomics by insulin and the promotion of glucose-lipid metabolism with extended duration.Poult Sci. 2025 Jan;104(1):104619. doi: 10.1016/j.psj.2024.104619. Epub 2024 Dec 2. Poult Sci. 2025. PMID: 39642750 Free PMC article.
-
Western diet augments metabolic and arterial dysfunction in a sex-specific manner in outbred, genetically diverse mice.Front Nutr. 2023 Jan 6;9:1090023. doi: 10.3389/fnut.2022.1090023. eCollection 2022. Front Nutr. 2023. PMID: 36687716 Free PMC article.
-
From glucose to histone modification: sex-specific metabolic responses to ketogenic therapy in VM/Dk mice.Front Nutr. 2025 Jun 19;12:1554743. doi: 10.3389/fnut.2025.1554743. eCollection 2025. Front Nutr. 2025. PMID: 40612298 Free PMC article.
-
Circulating Citrate Is Reversibly Elevated in Patients with End-Stage Liver Disease: Association with All-Cause Mortality.Int J Mol Sci. 2024 Nov 28;25(23):12806. doi: 10.3390/ijms252312806. Int J Mol Sci. 2024. PMID: 39684514 Free PMC article.
References
-
- Prevention, U.S.D.o.H.a.H.S.C.f.D.C.a., National Diabetes Statistics Report; Estimates of Diabetes and Its Burden in the United States. 2020.
-
- Clausen JO, et al., Insulin sensitivity index, acute insulin response, and glucose effectiveness in a population-based sample of 380 young healthy Caucasians. Analysis of the impact of gender, body fat, physical fitness, and life-style factors. J Clin Invest, 1996. 98(5): p. 1195–209. - PMC - PubMed
-
- Garaulet M, et al., Anthropometric, computed tomography and fat cell data in an obese population: relationship with insulin, leptin, tumor necrosis factor-alpha, sex hormone-binding globulin and sex hormones. Eur J Endocrinol, 2000. 143(5): p. 657–66. - PubMed
-
- Rune A, et al., Evidence against a sexual dimorphism in glucose and fatty acid metabolism in skeletal muscle cultures from age-matched men and post-menopausal women. Acta Physiol (Oxf), 2009. 197(3): p. 207–15. - PubMed
Publication types
MeSH terms
Substances
Grants and funding
LinkOut - more resources
Full Text Sources
Other Literature Sources
Miscellaneous

