

Visualization of superficial vein dynamics in dorsal hand by near-infrared imaging in response to elevated local temperature
- PMID: 33624459
- PMCID: PMC7900829
- DOI: 10.1117/1.JBO.26.2.026003
Visualization of superficial vein dynamics in dorsal hand by near-infrared imaging in response to elevated local temperature
Abstract
Significance: Dry or moist skin-contact thermal stimulation for vein puncture (VP) and vein cannulation (VC) may not be feasible for sensitive skin. For a damaged, burned, or dark skin, near-infrared (NIR) imaging is preferred to visualize a vein. Postprocessing of NIR images is always required because the skin is a reflective material and veins need segmentation for quantitative analysis.
Aim: Our pilot study aims to observe the effect of noncontact local heating on the superficial metacarpal veins in the dorsal surface of the hand and to visualize vein dynamics using an NIR imaging system.
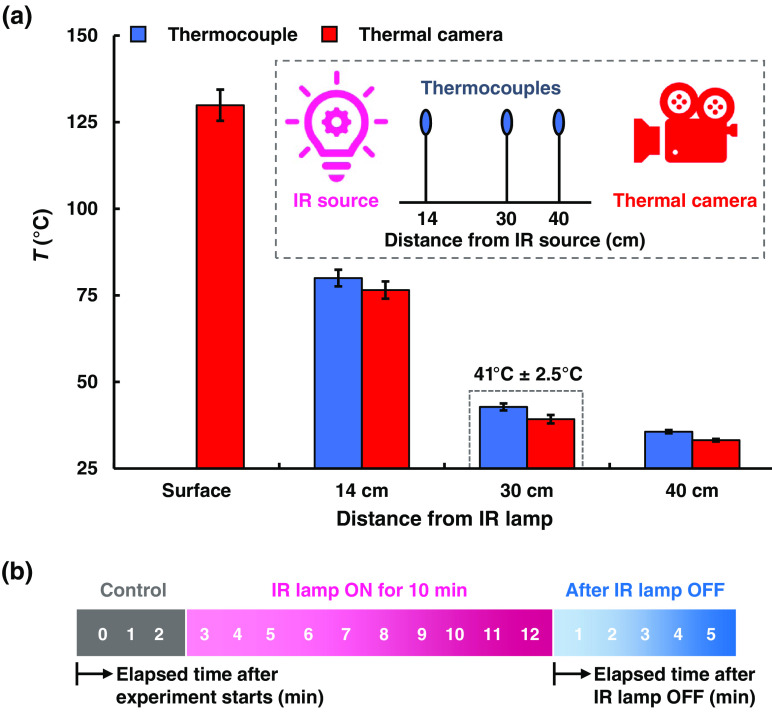
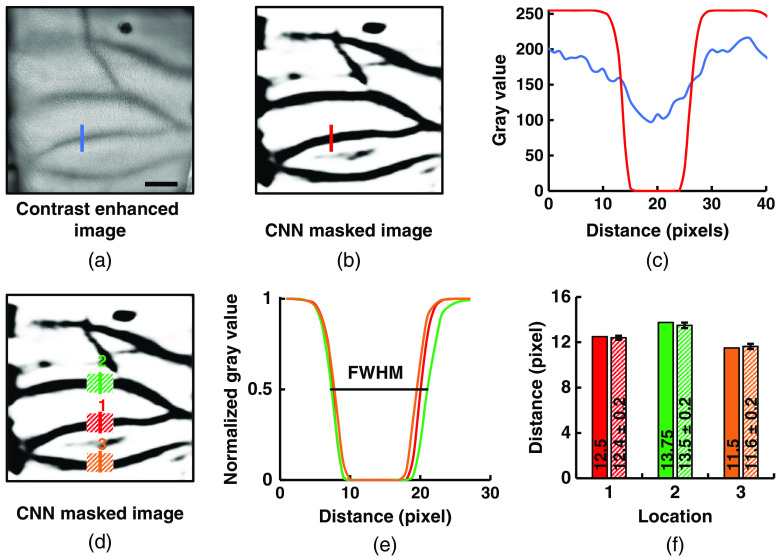
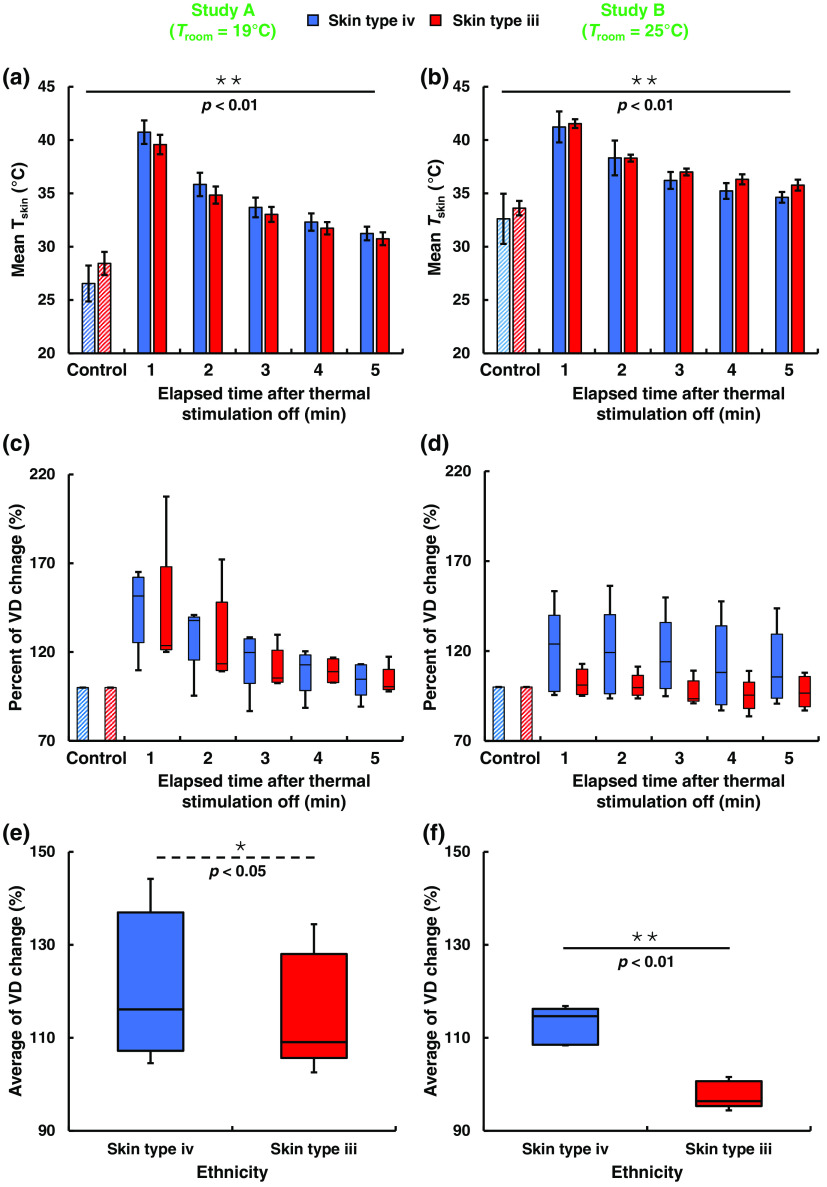
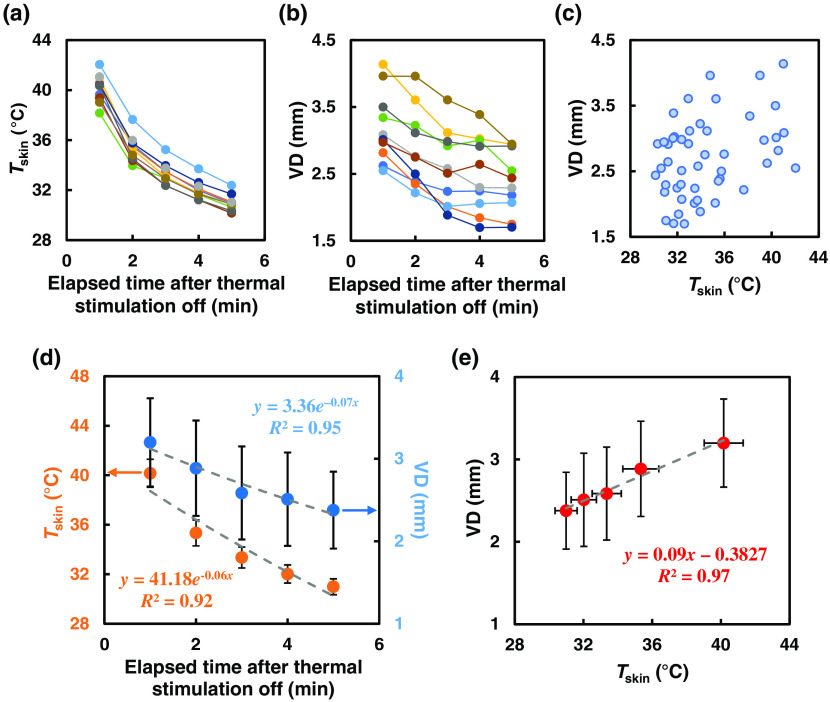
Approach: Our experiment consists of studies A and B at two ambient temperatures, 19°C and 25°C. A simple reflection-based NIR imaging system was installed to acquire sequential vein images for 5 min before and after applying 10 min of radiant thermal stimulation. To measure the vein diameter (VD), we trained a convolutional neural network (CNN) on sequential raw images to predict vein-segmentation masks as output images. Later these masked images were postprocessed for the VD measurements.
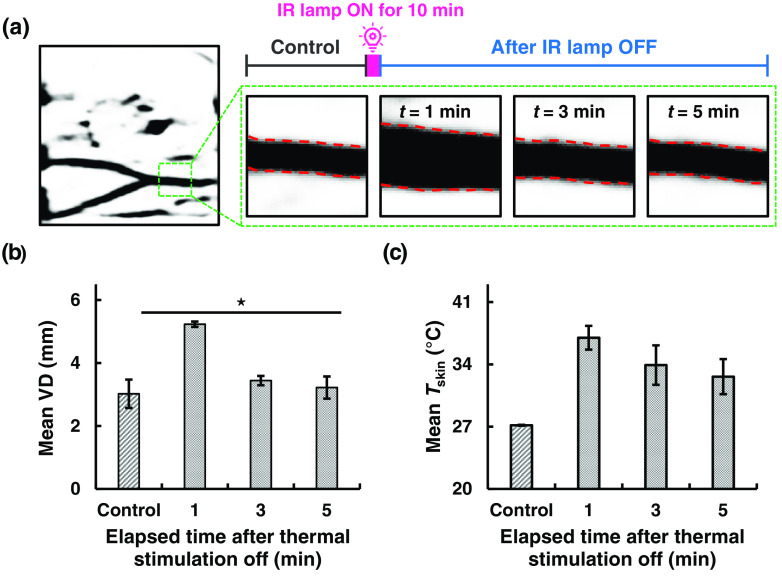
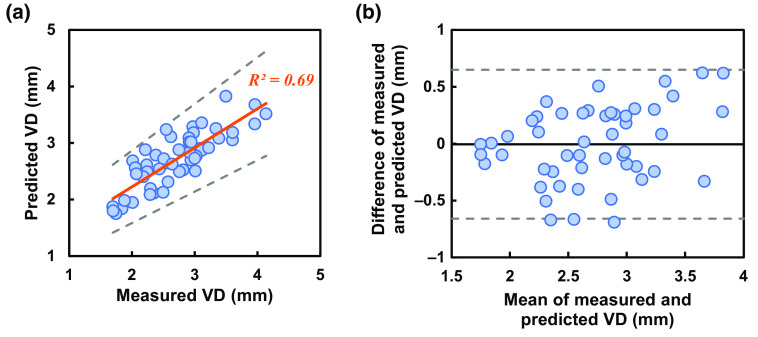
Results: The average VD was significantly increased after thermal stimulation in study A. The maximum increments in VD were 39.3% and 9.19%, 1 min after thermal stimulation in studies A and B, respectively. Both the VD and skin temperature (Tskin) follow negative exponentials in time, and the VD is proportional to Tskin. A multiple linear-regression model was made to predict the final VD. A significant difference was observed in the change of the VD.
Conclusions: NIR imaging with CNN can be used for quantitative analyses of vein dynamics. This finding can be further extended to develop real-time, image-guided medical devices by integrating them with a radiant heater and to assist medical practitioners in achieving high success rates for VP or VC.
Keywords: near-infrared imaging; skin temperature; vasomotor response; vein cannulation; vein diameter; vein puncture.
Figures

Similar articles
-
Estimation of core body temperature by near-infrared imaging of vein diameter change in the dorsal hand.Biomed Opt Express. 2021 Jul 6;12(8):4700-4712. doi: 10.1364/BOE.431534. eCollection 2021 Aug 1. Biomed Opt Express. 2021. PMID: 34513219 Free PMC article.
-
An improved YOLO Nano model for dorsal hand vein detection system.Med Biol Eng Comput. 2022 May;60(5):1225-1237. doi: 10.1007/s11517-022-02551-x. Epub 2022 Mar 27. Med Biol Eng Comput. 2022. PMID: 35347563 Review.
-
Competitive Real-Time Near Infrared (NIR) Vein Finder Imaging Device to Improve Peripheral Subcutaneous Vein Selection in Venipuncture for Clinical Laboratory Testing.Micromachines (Basel). 2021 Mar 30;12(4):373. doi: 10.3390/mi12040373. Micromachines (Basel). 2021. PMID: 33808493 Free PMC article.
-
Performance Evaluation of Dorsal Vein Network of Hand Imaging Using Relative Total Variation-Based Regularization for Smoothing Technique in a Miniaturized Vein Imaging System: A Pilot Study.Int J Environ Res Public Health. 2021 Feb 6;18(4):1548. doi: 10.3390/ijerph18041548. Int J Environ Res Public Health. 2021. PMID: 33561967 Free PMC article.
-
Near-Infrared Vein Visualization in Index Finger Pollicization.J Hand Surg Am. 2017 Jun;42(6):481.e1-481.e2. doi: 10.1016/j.jhsa.2017.03.039. Epub 2017 Apr 25. J Hand Surg Am. 2017. PMID: 28450097 Review.
Cited by
-
Estimation of core body temperature by near-infrared imaging of vein diameter change in the dorsal hand.Biomed Opt Express. 2021 Jul 6;12(8):4700-4712. doi: 10.1364/BOE.431534. eCollection 2021 Aug 1. Biomed Opt Express. 2021. PMID: 34513219 Free PMC article.
References
Publication types
MeSH terms
LinkOut - more resources
Full Text Sources
Other Literature Sources
Medical
Miscellaneous
