. 2021 Jul 2;33(5):1574-1593.
doi: 10.1093/plcell/koab070.

The NAC transcription factor FaRIF controls fruit ripening in strawberry

Affiliations

The NAC transcription factor FaRIF controls fruit ripening in strawberry

Carmen Martín-Pizarro et al. Plant Cell. .

Abstract

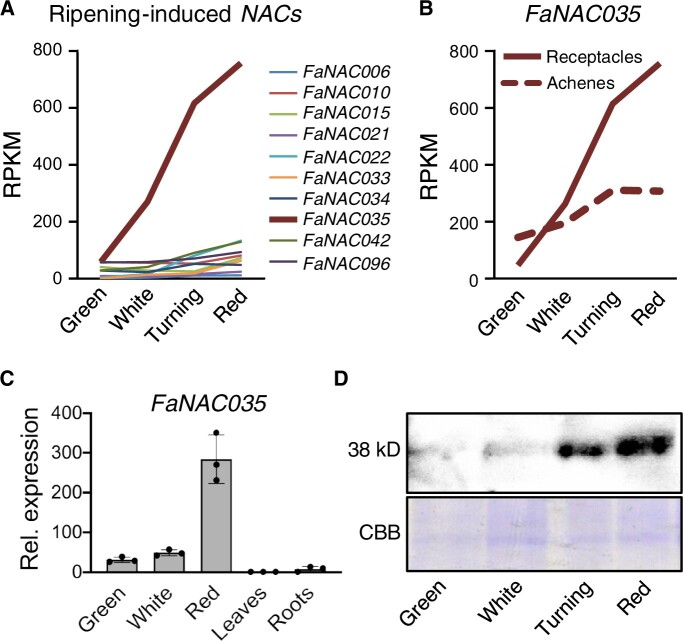
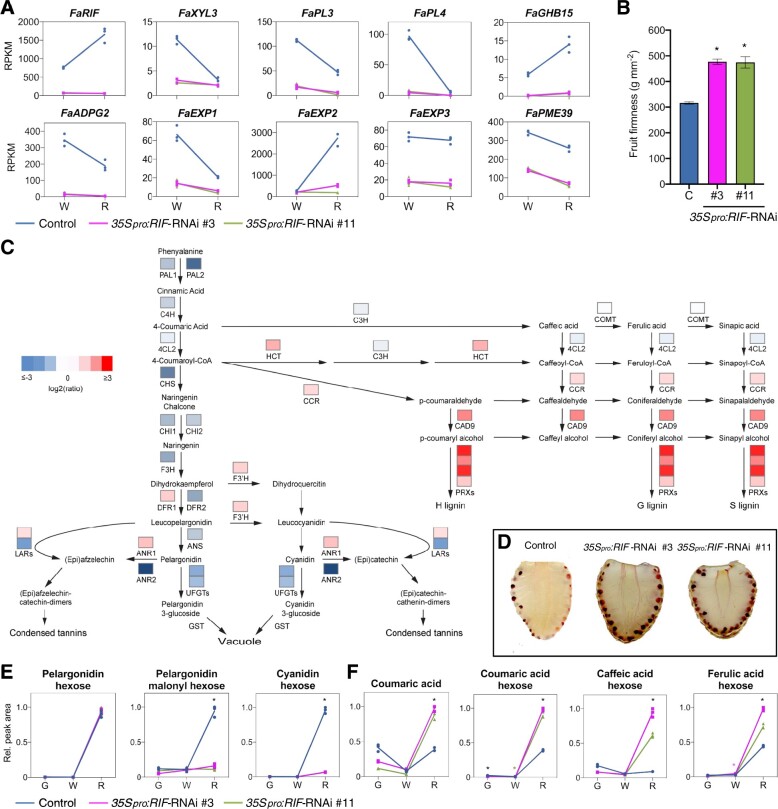
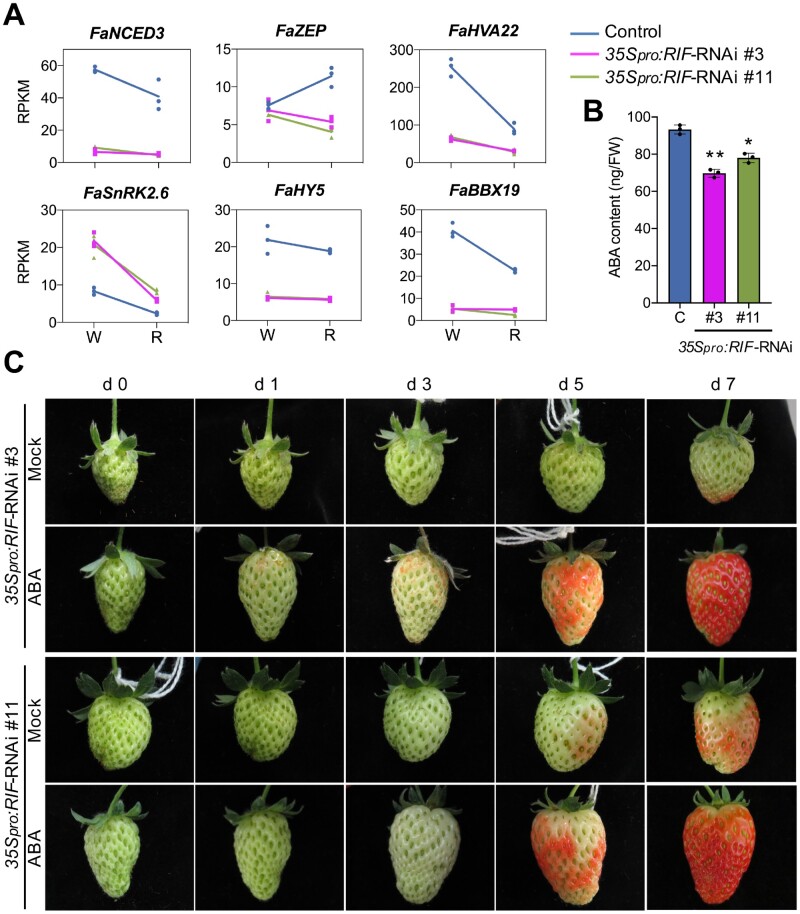
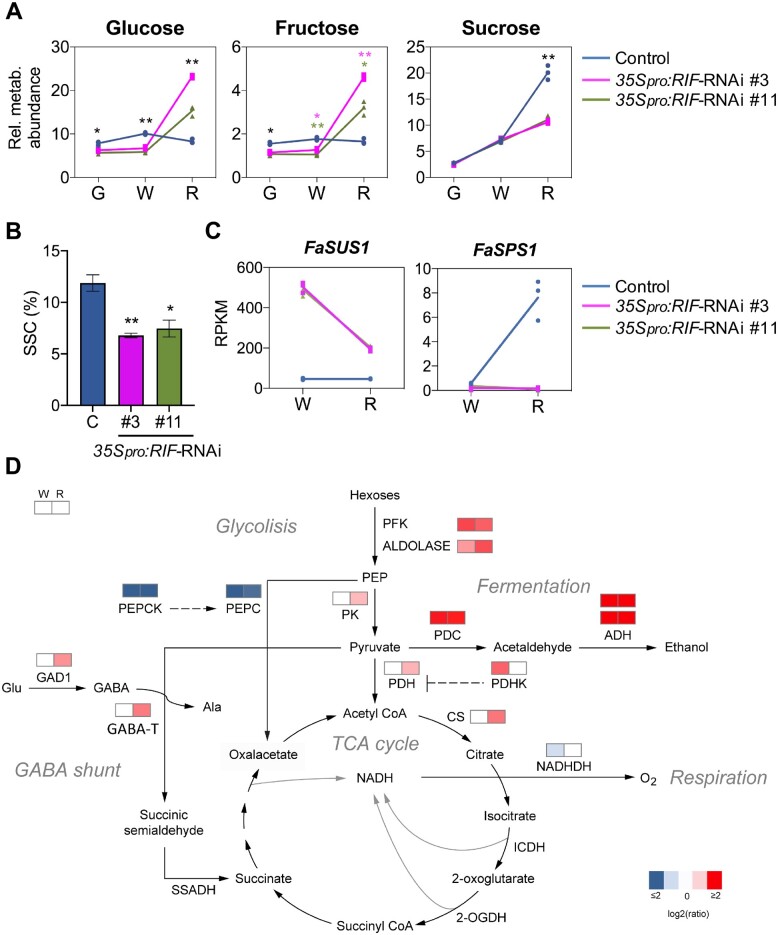
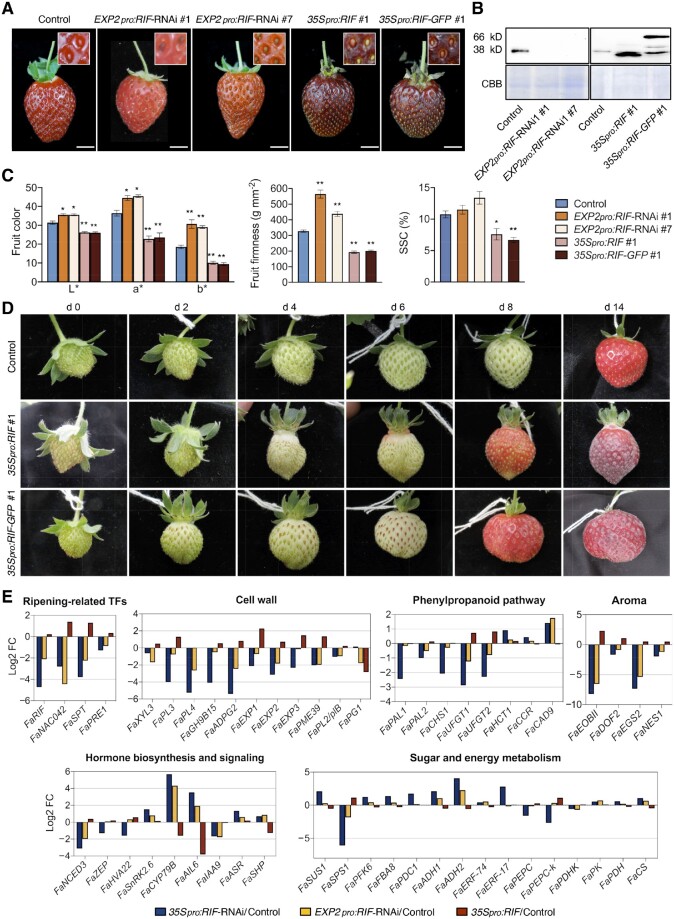
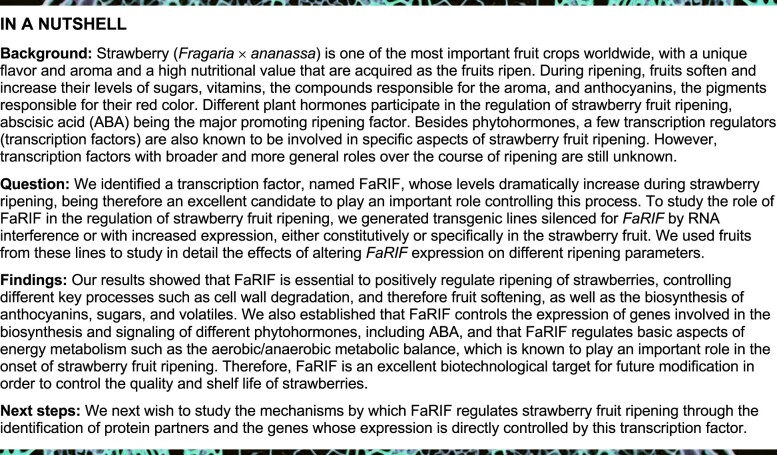
In contrast to climacteric fruits such as tomato, the knowledge on key regulatory genes controlling the ripening of strawberry, a nonclimacteric fruit, is still limited. NAC transcription factors (TFs) mediate different developmental processes in plants. Here, we identified and characterized Ripening Inducing Factor (FaRIF), a NAC TF that is highly expressed and induced in strawberry receptacles during ripening. Functional analyses based on stable transgenic lines aimed at silencing FaRIF by RNA interference, either from a constitutive promoter or the ripe receptacle-specific EXP2 promoter, as well as overexpression lines showed that FaRIF controls critical ripening-related processes such as fruit softening and pigment and sugar accumulation. Physiological, metabolome, and transcriptome analyses of receptacles of FaRIF-silenced and overexpression lines point to FaRIF as a key regulator of strawberry fruit ripening from early developmental stages, controlling abscisic acid biosynthesis and signaling, cell-wall degradation, and modification, the phenylpropanoid pathway, volatiles production, and the balance of the aerobic/anaerobic metabolism. FaRIF is therefore a target to be modified/edited to control the quality of strawberry fruits.


Figures

Figure 1
Figure 1
FaNAC035 gene expression and protein levels dramatically increase during strawberry receptacle ripening. A, B, Expression pattern of ripening-induced NAC transcription factor genes at four ripening stages in receptacles (A), and of FaNAC035 in receptacles and achenes (B); data from Sánchez-Sevilla et al. (2017). C, Relative expression of FaNAC035 in wild-type fruit receptacles at three ripening stages, leaves and roots, as determined by RT-qPCR. Data are means ± se of three biological replicates. D, Immunoblot analysis in wild-type fruit receptacles at four ripening stages to detect FaRIF protein (38 kD) using anti-FaRIF antibody (upper). CBB staining of total nuclear protein extracts are shown in the bottom panel as loading control.
Figure 2
Figure 2
35Spro:RIF-RNAi lines show a strong silencing of FaRIF and display a paler red color and a delay in ripening progression. A, Relative expression of FaRIF in ripe receptacles from control (C) and stable 35Spro:RIF-RNAi plants, as determined by RT-qPCR. B, Immunoblot analysis in ripe receptacles of control and stable 35Spro:RIF-RNAi plants to detect FaRIF protein (38 kD) using anti-FaRIF antibody (upper). CBB staining of total nuclear protein extracts are shown in the bottom panel as loading control. C, Color characterization in the CIELAB color space for the lightness-darkness coefficient (L*), green-red (a*), and yellow-blue spectrum (b*). D, Fruit phenotype at the red stage in control and stable 35Spro:RIF-RNAi transgenic lines. Inset: detail of the achenes. Scale bars, 1 cm. E, Representative pictures of a single fruit for each line at different times. A total of 10 fruits were marked at the same early green stage (Day 1), and the phenotypes were monitored 10, 15, 17, 24, and 30 days afterward. F, Percentage of fruits at each developmental/ripening stage for each time point. Ten fruits were analyzed per genotype. Data in (A) and (C) are means ± se of 3 and 10 biological replicates, respectively, analyzed by Student’s t-test (*P < 0.01; **P < 0.001).
Figure 3
Figure 3
FaRIF controls the expression of genes involved in cell-wall degradation and the phenylpropanoid pathway, controlling fruit firmness, and anthocyanin and lignin levels. A, Expression of FaRIF and genes involved in cell-wall degradation and modification in control and 35Spro:RIF-RNAi white (W) and red (R) receptacles. B, Fruit firmness measurement in control (C) and 35Spro:RIF-RNAi ripe receptacles. Data are means ± se of 10 biological replicates analyzed by Student’s t-test (*P < 0.001). C, Phenylpropanoid, flavonoid, and lignin biosynthetic pathways. Colors denote the average of the log2 of the 35Spro:RIF-RNAi/control expression ratio in both transgenic lines at the red stage for the respective genes. Red and blue show up- and downregulation, respectively, in both silenced lines. D, Lignin staining in ripe fruit sections from control and 35Spro:RIF-RNAi plants using phloroglucinol. Photographs were taken at the same distance. E, F, Changes in relative contents of anthocyanins (E) and hydroxycinnamic acid derivatives (F) in green (G), white (W), and red (R) receptacles of control and 35Spro:RIF-RNAi receptacles. Data in (E) and (F) were analyzed by Student’s t test (*P < 0.0005). Black asterisks indicate P < 0.0005 for both RNAi lines compared with the control. Colored asterisks denote P < 0.0005 for one of the RNAi lines compared with the control.
Figure 4
Figure 4
FaRIF regulates ABA biosynthesis and response. A, Expression of ABA biosynthetic (FaNCED3 and FaZEP) and -responsive (FaHVA22 and FaSnRK2.6) genes in control and 35Spro:RIF-RNAi white (W) and red (R) receptacles. B, ABA content (ng/FW) in control (C) and 35Spro:RIF-RNAi red receptacles. Data are means ± se of three biological replicates, analyzed by Student’s t test (*P < 0.005; **P < 0.0005). C, Ripening progression in 35Spro:RIF-RNAi receptacles 7 days after mock-infiltration with 2% ethanol or 100 μM ABA. Representative pictures of a single fruit for each 35Spro:RIF-RNAi line in each condition out of three biological replicates are shown. Fruit size cannot be directly compared across panels.
Figure 5
Figure 5
FaRIF contributes to the regulation of primary and energy metabolism. A, Content of main sugars in control and 35Spro:RIF-RNAi receptacles at three ripening stages. Data are normalized to the mean response calculated for an internal control. B, Quantification of SSC. C, Expression of genes involved in sucrose metabolism supporting higher levels of glucose and fructose and lower levels of sucrose. D, Expression of genes involved in glycolysis, TCA cycle, fermentation, respiration, and GABA shunt by RNA-seq. Colors denote the average log2 fold-change of 35Spro:RIF-RNAi/control in both transgenic lines, at the white and red stages. Red and blue show up- and downregulation, respectively, in both silenced lines. Data in (A) and (B) are from three and 10 biological replicates, respectively, analyzed by Student’s t test (*P < 0.01; **P < 0.001). Colored asterisks denote significant difference for one of the RNAi lines compared with the control. G, green; W, white; R, red receptacles.
Figure 6
Figure 6
Effects on ripening when FaRIF is specifically silenced at late stages of receptacle ripening (EXP2 promoter) or overexpressed (35S promoter). A, Fruit phenotype at the red stage in control and stable EXP2pro:RIF-RNAi, 35Spro:RIF and 35Spro:RIF-GFP transgenic lines. Inset: detail of the achenes. Scale bars, 1 cm. B, Immunoblot analysis in control and stable EXP2pro:RIF-RNAi, 35Spro:RIF and 35Spro:RIF-GFP ripe receptacles to detect native FaRIF protein (38 kD) and FaRIF–GFP fusion protein (66 kD) using anti-FaRIF antibody (upper). CBB staining of total nuclear protein extracts are shown in the (bottom) as loading control. C, Color characterization in the CIELAB color space for the lightness coefficient (L*), green-red (a*), and yellow-blue spectrum (b*) (left plot); fruit firmness measurements (middle plot); quantification of SSC (right plot). Data are means ± se of 10 biological replicates analyzed by Student’s t test (*P < 0.05; **P < 0.001). D, Representative pictures of a single fruit for control and FaRIF overexpression lines out of 10 analyzed showing the color progression over 14 days. Fruit size cannot be directly compared across panels. E, Log2 fold-change of genes involved in different processes in 35Spro:RIF-RNAi, EXP2pro:RIF-RNAi, and 35Spro:RIF.
None

Similar articles

Cited by

References

    1. Aharoni A, De Vos CH, Wein M, Sun Z, Greco R, Kroon A, Mol JN, O’Connell AP (2001) The strawberry FaMYB1 transcription factor suppresses anthocyanin and flavonol accumulation in transgenic tobacco. Plant J 28: 319–332 - PubMed
    1. Aharoni A, Giri AP, Verstappen FWA, Bertea CM, Sevenier R, Sun Z, Jongsma MA, Schwab W, Bouwmeester HJ (2004) Gain and loss of fruit flavor compounds produced by wild and cultivated strawberry species. Plant Cell 16: 3110–3131 - PMC - PubMed
    1. Bai M, Sun J, Liu J, Ren H, Wang K, Wang Y, Wang C, Dehesh K (2019) The B‐box protein BBX19 suppresses seed germination via induction of ABI5. Plant J 99: 1192–1202 - PMC - PubMed
    1. Banti V, Giuntoli B, Gonzali S, Loreti E, Magneschi L, Novi G, Paparelli E, Parlanti S, Pucciariello C, Santaniello A, Perata P (2013) Low oxygen response mechanisms in green organisms. Int J Mol Sci 14: 4734–4761 - PMC - PubMed
    1. Barceló M, Mansouri ElI, Mercado J-Á, Quesada MA, Pliego-Alfaro F (1998) Regeneration and transformation via Agrobacterium tumefaciens of the strawberry cultivar Chandler. Plant Cell Tissue Organ Culture 54: 29–36

Publication types

MeSH terms