SARS-CoV-2 innate effector associations and viral load in early nasopharyngeal infection
- PMID: 33625796
- PMCID: PMC7903990
- DOI: 10.14814/phy2.14761
SARS-CoV-2 innate effector associations and viral load in early nasopharyngeal infection
Abstract
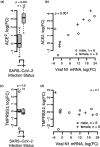
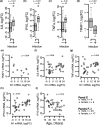
COVID-19 causes severe disease with poor outcomes. We tested the hypothesis that early SARS-CoV-2 viral infection disrupts innate immune responses. These changes may be important for understanding subsequent clinical outcomes. We obtained residual nasopharyngeal swab samples from individuals who requested COVID-19 testing for symptoms at drive-through COVID-19 clinical testing sites operated by the University of Utah. We applied multiplex immunoassays, real-time polymerase chain reaction assays and quantitative proteomics to 20 virus-positive and 20 virus-negative samples. ACE-2 transcripts increased with infection (OR =17.4, 95% CI [CI] =4.78-63.8) and increasing viral N1 protein transcript load (OR =1.16, CI =1.10-1.23). Transcripts for two interferons (IFN) were elevated, IFN-λ1 (OR =71, CI =7.07-713) and IFN-λ2 (OR =40.2, CI =3.86-419), and closely associated with viral N1 transcripts (OR =1.35, CI =1.23-1.49 and OR =1.33 CI =1.20-1.47, respectively). Only transcripts for IP-10 were increased among systemic inflammatory cytokines that we examined (OR =131, CI =1.01-2620). We found widespread discrepancies between transcription and translation. IFN proteins were unchanged or decreased in infected samples (IFN-γ OR =0.90 CI =0.33-0.79, IFN-λ2,3 OR =0.60 CI =0.48-0.74) suggesting viral-induced shut-off of host antiviral protein responses. However, proteins for IP-10 (OR =3.74 CI =2.07-6.77) and several interferon-stimulated genes (ISG) increased with viral load (BST-1 OR =25.1, CI =3.33-188; IFIT1 OR =19.5, CI =4.25-89.2; IFIT3 OR =245, CI =15-4020; MX-1 OR =3.33, CI =1.44-7.70). Older age was associated with substantial modifications of some effects. Ambulatory symptomatic patients had an innate immune response with SARS-CoV-2 infection characterized by elevated IFN, proinflammatory cytokine and ISG transcripts, but there is evidence of a viral-induced host shut-off of antiviral responses. Our findings may characterize the disrupted immune landscape common in patients with early disease.
Keywords: SARS-CoV-2; biomarkers; host shut-off; innate immunity; interferon.
© 2021 The Authors. Physiological Reports published by Wiley Periodicals LLC on behalf of The Physiological Society and the American Physiological Society.
Conflict of interest statement
TGL, JLS, and KAP are supported by NIH/NHLBI R01 125520 and by the US Cystic Fibrosis Foundation, Bethesda, MD, grants LIOU13A0, LIOU14P0, LIOU14Y4, LIOU15Y4. During the course of the study, TGL, JLS, and KAP received other support for performing cystic fibrosis‐related clinical trials from Abbvie, Inc; Corbus Pharmaceuticals Holdings, Inc; Gilead Sciences, Inc.; Laurent Pharmaceuticals, Inc; Nivalis Therapeutics, Inc; Novartis Pharmaceuticals; Proteostasis Therapeutics, Inc; Savara, Inc; TranslateBio; and Vertex Pharmaceuticals, Inc. None of the funding was provided for the development of vaccines or treatments for SARS‐CoV‐2 infection. FRA received other support from the National Science Foundation (grant EMSW21‐RTG) and NIH (NIH‐CSBC: U54 CA20). JEC is supported by NIH/NIDDK U54 DK110858 05. MNH is supported by NIH/NHLBI R01HL137033. CK received support from the UK Medical Research Council. DTL is supported by NIH/NAIAD R01AI130378. The sponsors of clinical trials and funders of other support played no roles in this study.
Figures


Update of
-
SARS-CoV-2 Innate Effector Associations and Viral Load in Early Nasopharyngeal Infection.medRxiv [Preprint]. 2020 Nov 4:2020.10.30.20223545. doi: 10.1101/2020.10.30.20223545. medRxiv. 2020. Update in: Physiol Rep. 2021 Feb;9(4):e14761. doi: 10.14814/phy2.14761. PMID: 33173878 Free PMC article. Updated. Preprint.
References
-
- Bandyopadhyay, S. K. , Leonard, G. T. , Bandyopadhyay, T. , Stark, G. R. , & Sen, G. C. (1995). Transcriptional induction by double‐stranded RNA is mediated by interferon‐stimulated response elements without activation of interferon‐stimulated gene factor 3. Journal of Biological Chemistry, 270(33), 19624–19629. - PubMed
-
- Chambers, J. M. (1998). Programming with data: a guide to the S language. Springer.
Publication types
MeSH terms
Substances
Grants and funding
- K08 HL153953/HL/NHLBI NIH HHS/United States
- Ben B and Iris M Margolis Family Foundation of Utah
- IK2 BX004219/BX/BLRD VA/United States
- UL1 TR002538/TR/NCATS NIH HHS/United States
- U54 DK110858/DK/NIDDK NIH HHS/United States
- U54DK11085805/DK/NIDDK NIH HHS/United States
- 5P30CA042014-24/CA/NCI NIH HHS/United States
- P30 CA042014/CA/NCI NIH HHS/United States
- S10 OD018210/OD/NIH HHS/United States
- Claudia Ruth Goodrich Stevens Endowment Fund at the University of Utah
- S10OD01821001A1/NH/NIH HHS/United States
- R01 HL125520/HL/NHLBI NIH HHS/United States
- I01 BX001777/BX/BLRD VA/United States
LinkOut - more resources
Full Text Sources
Other Literature Sources
Medical
Research Materials
Miscellaneous

