. 2021 Apr 15;32(8):703-711.
doi: 10.1091/mbc.E20-08-0508. Epub 2021 Feb 24.

Direct and indirect regulation of Pom1 cell size pathway by the protein phosphatase 2C Ptc1

Affiliations

Direct and indirect regulation of Pom1 cell size pathway by the protein phosphatase 2C Ptc1

Veneta Gerganova et al. Mol Biol Cell. .

Abstract

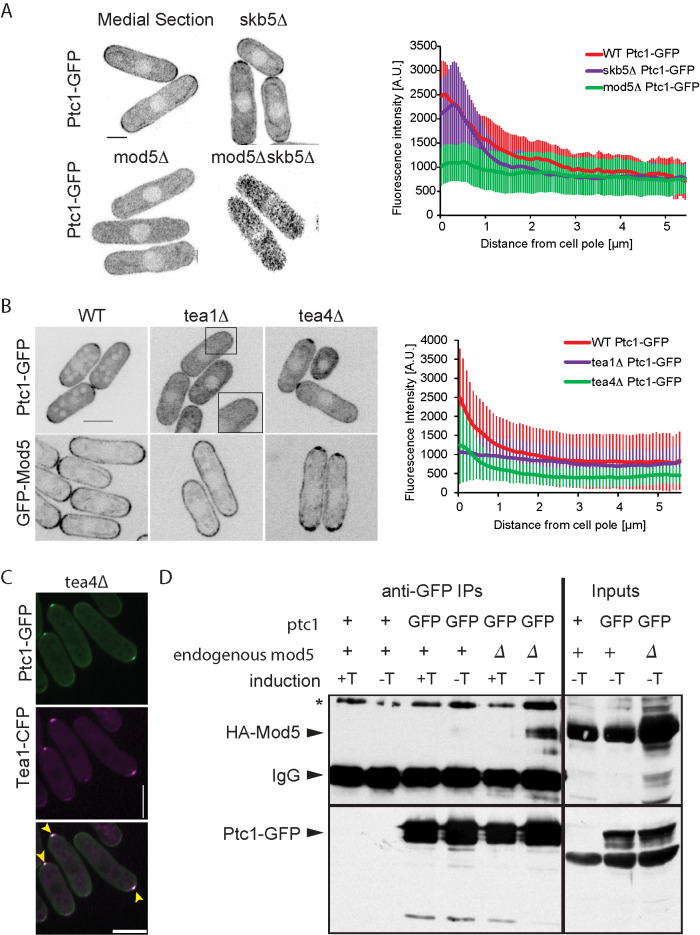
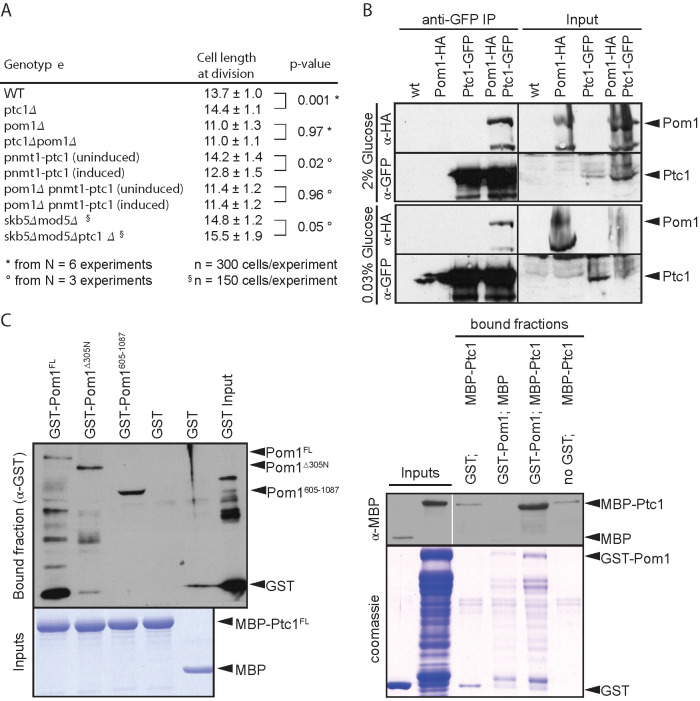
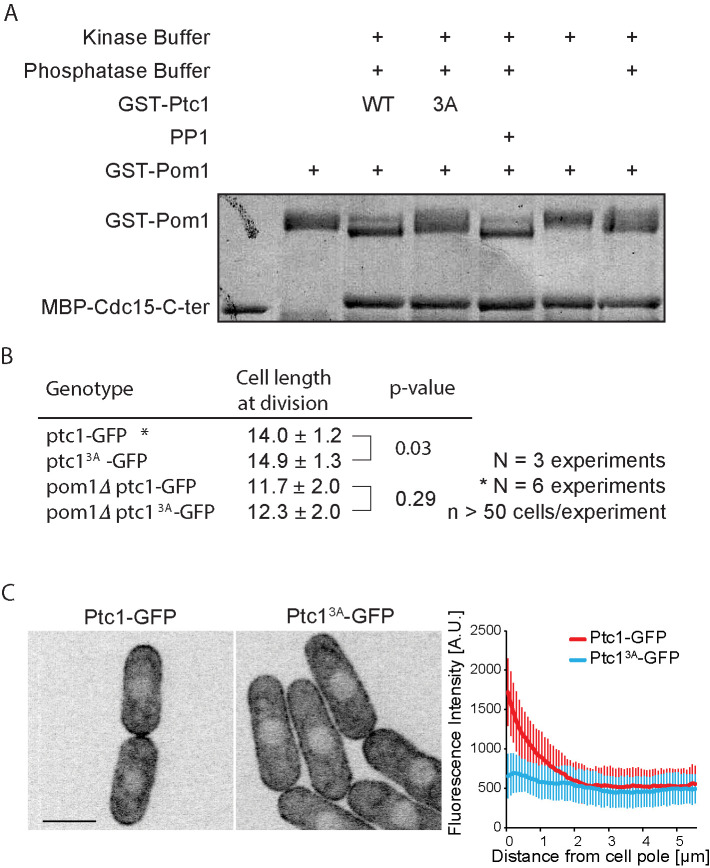
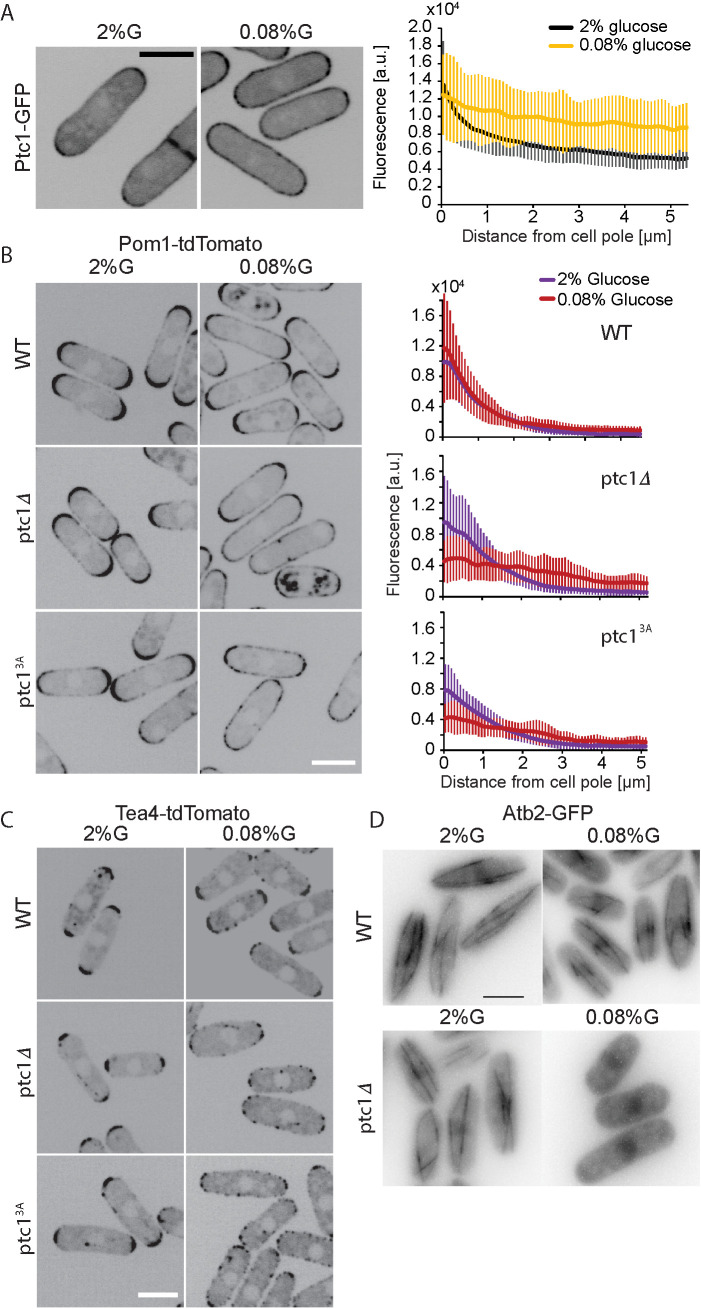
The fission yeast cells Schizosaccharomyces pombe divide at constant cell size regulated by environmental stimuli. An important pathway of cell size control involves the membrane-associated DYRK-family kinase Pom1, which forms decreasing concentration gradients from cell poles and inhibits mitotic inducers at midcell. Here, we identify the phosphatase 2C Ptc1 as negative regulator of Pom1. Ptc1 localizes to cell poles in a manner dependent on polarity and cell-wall integrity factors. We show that Ptc1 directly binds Pom1 and can dephosphorylate it in vitro but modulates Pom1 localization indirectly upon growth in low-glucose conditions by influencing microtubule stability. Thus, Ptc1 phosphatase plays both direct and indirect roles in the Pom1 cell size control pathway.


Figures

FIGURE 1:
FIGURE 1:
Ptc1 localizes to the cell cortex. (A) Localization of Ptc1-GFP in wild-type, skb5Δ, mod5Δ, and mod5Δskb5Δ fission yeast cells. Left, a medial section of Airyscan imaging acquired with identical settings. Contrasting was increased postacquisition on the mod5Δskb5Δ image. Right, Average cortical profile of Ptc1-GFP in wild-type cells (n = 20 cells). Error bars are standard deviations. (B) Ptc1-GFP and GFP-Mod5 localization in tea1Δ and tea4Δ. Left, a medial section of spinning-disk imaging acquired with identical settings. Right, average cortical profile of Ptc1-GFP in wild-type, tea1∆, and tea4∆ cells (n = 20 cells). Error bars are standard deviations. (C) Spinning-disk imaging of colocalization of Tea1-CFP and Ptc1-GFP (acquired in the YFP channel) in tea4∆ cells. Yellow arrowheads indicate colocalizing Tea1 and Ptc1 dots. False color image of Tea1-CFP. (D) Coimmunoprecipitation of HA-Mod5 and Ptc1-GFP from mod5∆ cells expressing HA-Mod5 on a plasmid under the inducible Pnmt1 promoter. HA-Mod5 induction was performed by growing cells in absence of thiamine (−T). Ptc1-GFP was immunoprecipitated using anti-GFP antibody and coimmunoprecipitation of Mod5 was revealed using anti-HA antibody. Note that coimmunoprecipitation of HA-Mod5 was more marked in absence of endogenous untagged Mod5. IgG serves as the immunoprecipitation control. Inputs are shown on the right. + symbols indicate untagged wild-type Ptc1 or Pom1. Images are sum projections of five confocal images acquired over time. Scale bars: 3 µm in A; 5 µm in B and C.
FIGURE 2:
FIGURE 2:
Ptc1 localization to the plasma membrane is dependent on Skb5 and Mod5. (A) Cell lengths at division quantified from at least three independent experiments; statistical significance measured by Student’s t test across experiments against either wild-type or uninduced counterpart. The indicated variation is the SD across cells. (B) Coimmunoprecipitation of Ptc1-GFP and Pom1-HA. Protein extracts were made from cells grown in 2% glucose for 24 h and from cells shifted to 0.03% glucose for 2 h. Whole cell extract (2 mg) was used for immunoprecipitation assay. Inputs (100 µg) were loaded. Note that the levels of Pom1-HA detected in the inputs are variable across experiments. (C) Pom1 binds Ptc1 in vitro. Bacterially expressed proteins assayed by affinity columns. GST tagged Pom1FL and fragments Pom1Δaa305N and Pom1aa605-1087 tested for interaction with recombinant MBP-tagged Ptc1FL. Left, MBP-bound proteins were immobilized on amylose columns. Right, GST-bound proteins were bound to glutathione beads.
FIGURE 3:
FIGURE 3:
Ptc1 dephosphorylates Pom1 in vitro and its activity contributes to its localization. (A) In vitro phosphatase assay, using recombinant proteins. Autophosphorylated recombinant GST-Pom1 was used as substrate and incubated with recombinant GST-Ptc1 (WT or 3A mutant) or commercial PP1 as indicated. Autophosphorylated Pom1 migrates as a smear, which collapses to two fast-migrating bands upon dephosphorylation. Phosphatase-treated Pom1 was then used in a kinase assay to monitor Pom1 activity. Recombinant MBP-Cdc15C was used as Pom1 substrate, as this fragment is quantitatively phosphorylated by Pom1 leading to slower migration (Bhattacharjee et al., 2020). Note that the phosphorylation status of Pom1 does not alter its activity toward Cdc15C. (B) Cell lengths at division quantified from more than 160 cells in three independent experiments; statistical significance measured by Student’s t test against wild type or pom1∆. (C) Localization of Ptc1-GFP and Ptc13A-GFP (left) and quantification of cortical profiles (right). Scale bar: 5 µm.
FIGURE 4:
FIGURE 4:
Ptc1 keeps Pom1 from spreading to the cell sides in limited glucose conditions. (A) Localization of Ptc1-GFP in EMM-ALU 2% glucose and 0.08% glucose. Graph on right shows average profiles of wild-type Ptc1-GFP from n = 20 cells. Individual profiles are shown in Supplemental Figure S4B. Error bars are standard deviations. (B) Localization of Pom1-tdTomato in wild type, ptc1∆, and ptc13A-GFP (GFP not shown). Graphs on the right show average fluorescence profiles of Pom1-tdTomato obtained from individual cells (n = 20). Error bars are standard deviations. (C) Localization of Tea4-tdTomato in wild-type, ptc1∆, and ptc13A-GFP backgrounds (GFP not shown). (D) Atb2-GFP signal in wild-type and ptc1∆ backgrounds. Widefield microscopy. The indicated time is the exact time point during the imaging interval. In all panels, cells were grown in 2% glucose (G) for 24 h and shifted to 0.08% glucose for 1 h before imaging. In A–C, images are sum projections of five confocal images acquired over time. In D, the images shown were taken 1 h 30 min (top) and 1 h 10 min (bottom) after transfer to 0.08% glucose. Scale bars: 5 µm.

Similar articles

Cited by

References

    1. Allard CAH, Opalko HE, Liu KW, Medoh U, Moseley JB (2018). Cell size-dependent regulation of Wee1 localization by Cdr2 cortical nodes. J Cell Biol 217, 1589–1599. - PMC - PubMed
    1. Allard CAH, Opalko HE, Moseley JB (2019). Stable Pom1 clusters form a glucose-modulated concentration gradient that regulates mitotic entry. eLife 8, e46003. - PMC - PubMed
    1. Arellano M, Niccoli T, Nurse P (2002). Tea3p is a cell end marker activating polarized growth in Schizosaccharomyces pombe. Curr Biol 12, 751–756. - PubMed
    1. Arino J, Casamayor A, Gonzalez A (2011). Type 2C protein phosphatases in fungi. Eukaryot Cell 10, 21–33. - PMC - PubMed
    1. Bähler J, Wu JQ, Longtine MS, Shah NG, McKenzie A 3rd, Steever AB, Wach A, Philippsen P, Pringle JR (1998). Heterologous modules for efficient and versatile PCR-based gene targeting in Schizosaccharomyces pombe. Yeast 14, 943–951. - PubMed

Publication types

MeSH terms

LinkOut - more resources