. 2021 May 1;125(5):1938-1953.
doi: 10.1152/jn.00410.2020. Epub 2021 Feb 24.

Medial olivocochlear reflex effects on amplitude growth functions of long- and short-latency components of click-evoked otoacoustic emissions in humans

Affiliations

Medial olivocochlear reflex effects on amplitude growth functions of long- and short-latency components of click-evoked otoacoustic emissions in humans

Shawn S Goodman et al. J Neurophysiol. .

Abstract

Functional outcomes of medial olivocochlear reflex (MOCR) activation, such as improved hearing in background noise and protection from noise damage, involve moderate to high sound levels. Previous noninvasive measurements of MOCR in humans focused primarily on otoacoustic emissions (OAEs) evoked at low sound levels. Interpreting MOCR effects on OAEs at higher levels is complicated by the possibility of the middle-ear muscle reflex and by components of OAEs arising from different locations along the length of the cochlear spiral. We overcame these issues by presenting click stimuli at a very slow rate and by time-frequency windowing the resulting click-evoked (CE)OAEs into short-latency (SL) and long-latency (LL) components. We characterized the effects of MOCR on CEOAE components using multiple measures to more comprehensively assess these effects throughout much of the dynamic range of hearing. These measures included CEOAE amplitude attenuation, equivalent input attenuation, phase, and slope of growth functions. Results show that MOCR effects are smaller on SL components than LL components, consistent with SL components being generated slightly basal of the characteristic frequency region. Amplitude attenuation measures showed the largest effects at the lowest stimulus levels, but slope change and equivalent input attenuation measures did not decrease at higher stimulus levels. These latter measures are less commonly reported and may provide insight into the variability in listening performance and noise susceptibility seen across individuals.NEW & NOTEWORTHY The auditory efferent system, operating at moderate to high sound levels, may improve hearing in background noise and provide protection from noise damage. We used otoacoustic emissions to measure these efferent effects across a wide range of sound levels and identified level-dependent and independent effects. Previous reports have focused on level-dependent measures. The level-independent effects identified here may provide new insights into the functional relevance of auditory efferent activity in humans.

Keywords: auditory; efferent; medial olivocochlear; otoacoustic emissions.


Conflict of interest statement

No conflicts of interest, financial or otherwise, are declared by the authors.

Figures

None
Graphical abstract
Figure 1.
Figure 1.
Test paradigm. A: illustration of a click train. Clicks were spaced 200 ms apart. Trains consisted of clicks at three stimulus levels, spaced as shown. A “low-level train” contained levels of 55, 64, and 73 dB ppFPL, whereas a “high-level train” contained levels of 73, 82, and 91 dB pp FPL. The illustration is of one click train but schematizes both low- and high-level trains. An 800 ms of silence preceded the onset of the clicks, and 600 ms of silence followed the offset (i.e., a 1.4-s intertrain interval). Each train was 16 s long and contained 64 low-, eight medium-, and two high-level clicks. Note that click levels of 73 dB ppFPL were presented in both low-level and high-level trains, occupying either the highest or lowest click level in the train, respectively. During post hoc data analysis, the 73 dB ppFPL responses from both trains were combined after ensuring that there were no systematic differences between the two (mean absolute difference = 0.72 dB, SD = 0.56). B: stimulus block. Six click trains were grouped together to form a block. Broadband acoustic noise was interleaved throughout the block, presented simultaneously with every other click train, as shown. Clicks and noise were presented through separate loudspeakers in the ipsilateral probe assembly, and noise was presented through a single loudspeaker in the contralateral probe assembly. Each block was 96 s long. C: full recording set. A total of 36 blocks were recorded from each participant. Of the 36 blocks in the experiment, 29 were low-level click trains and seven were high-level click trains. D: inset showing the ramping on and off of ipsilateral noise during the with-noise conditions. Ipsilateral noise was gated off 10 ms prior to each click presentation and then gated back on 20 ms afterward. Vertical dashed lines indicate the temporal locations of click presentations. In this panel, time is shown relative to the temporal location of the first dashed vertical line. ppFPL, peak-to-peak forward pressure level.
Figure 2.
Figure 2.
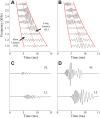
Separation of CEOAE waveforms into short latency (SL) and long latency (LL) components. Data are shown for two click levels from one representative participant. A: CEOAE waveforms evoked by the lowest click level after gammatone filtering. Y-axis values are the center frequency of the filters. Solid, red sloping lines indicate the start and the end of the waveforms retained for analysis, as a function of frequency. Dashed sloping red lines denote the boundary between SL and LL. B: CEOAE waveforms evoked by the second-highest click level after filtering. Layout is the same as in A, except that the waveforms were scaled down in amplitude for visual clarity. C: waveforms obtained by summing the filtered, time-windowed waveforms from the lowest click level (shown in A). D: waveforms obtained by summing the time-windowed, filtered waveforms from the second-highest click level (shown in B). CEOAE, click-evoked otoacoustic emission.
Figure 3.
Figure 3.
AD: examples of curve fitting to obtain amplitude growth functions. Each row shows data from one participant. Left and right columns show short latency (SL) and long latency (LL) responses, respectively. Red circles show CEOAE amplitudes obtained without noise activators. Blue triangles show amplitudes obtained with noise activators. Red and blue solid lines show the obtained amplitude growth functions. Dash-dot black lines show the noise floors. For visual comparison to linear growth, dashed gray lines toward the upper left of each panel show unity slopes. In D, circled lower-case letters and black arrows illustrate amplitude output attenuation (b-a) and equivalent input attenuation (c-b) for a single stimulus level. The fitting routine was able to adequately fit the variety of amplitude growth functions seen across participants. CEOAE, click-evoked otoacoustic emission; ppFPL, peak-to-peak forward pressure level.
Figure 4.
Figure 4.
Effects of MOCR on CEOAE amplitude growth. Top: box plots show CEOAE amplitude as a function of stimulus level for short latency (SL, A) and long latency (LL, B) components. Amplitudes obtained without noise are plotted offset to the left in red, and amplitudes obtained with noise are plotted offset to the right in blue. Box plots are overlaid with curves showing median amplitude growth functions. For visual comparison to linear growth, dashed gray lines toward the upper left of the panels show unity slopes. The number of participants included at each stimulus level is shown by numbers enclosed in parentheses along the bottom of A and B. Middle: C and D show slopes of CEOAE amplitude growth functions. Layout is similar to the top row. Bottom: E shows changes in slope (slope obtained with noise activator minus slope obtained without noise activator) for SL (black) and LL (gray) components as a function of stimulus level. Positive values on the y-axis indicate that slope increased (became less compressive) with MOCR activation. F compares changes in slope between SL and LL components (the differences between the pair of black and gray boxplots at each stimulus level). Positive values on the y-axis indicate that MOCR activation caused a larger slope change in LL components than SL components. These data show that, on average, SL components grew more linearly than LL components with click level. MOCR activation caused growth functions to become more linear for both SL and LL components. CEOAE, click-evoked otoacoustic emission; MOCR, medial olivocochlear reflex; ppFPL, peak-to-peak forward pressure level.
Figure 5.
Figure 5.
Top: percentage attenuation in CEOAE output amplitude (black) and equivalent input (gray) as a function of stimulus level for short latency (SL, A) and long latency (LL, B) waveforms. Black boxplots show percent amplitude output attenuation at each stimulus level. Gray boxplots show equivalent input attenuation. For visual clarity, boxplots are offset to the left (output) and to the right (equivalent input) of stimulus level. Positive values on the y-axes indicate that CEOAE amplitude decreased with MOCR activation, with larger values indicating larger reductions. Bottom: differences in attenuation at long latency versus short latency components (LL − SL). C shows differences in amplitude output attenuation. Positive values indicate that LL attenuation was greater than SL attenuation. D shows differences in equivalent input attenuation, with positive values again indicating larger attenuation for LL components. MOCR effects on LL components were larger than on SL components, and equivalent input attenuation was larger than output attenuation. CEOAE, click-evoked otoacoustic emission; MOCR, medial olivocochlear reflex; ppFPL, peak-to-peak forward pressure level.
Figure 6.
Figure 6.
Top: changes in CEOAE phase a function of stimulus level for short latency (SL, A) and long latency (LL, B) components. Positive values on the y-axis indicate a phase lead in the presence of MOCR activation. Data from participants with no SSOAEs are shown by pink boxplots; data from the full cohort are shown by red boxplots. Bottom: percentage reductions in CEOAE amplitude only (black), phase only (red), and total quantity (both amplitude and phase; gray) as a function of stimulus level for SL (C) and LL (D) components. Boxplots shown with horizontal offsets for visual clarity. Including phase with amplitude increases the calculated size of MOCR effects. LL components showed larger attenuation than on SL components. CEOAE, click-evoked otoacoustic emission; MOCR, medial olivocochlear reflex; ppFPL, peak-to-peak forward pressure level; SSOAEs, synchronous-spontaneous otoacoustic emissions.

Similar articles

Cited by

References

    1. Guinan JJ Jr.Olivocochlear efferents: anatomy, physiology, function, and the measurement of efferent effects in humans. Ear Hear 27: 589–607, 2006[Erratum inEar Hear28: 129, 2007]. doi:10.1097/01.aud.0000240507.83072.e7. - DOI - PubMed
    1. Guinan JJ Jr.Physiology of olivocochlear efferents. In: The Cochlea, edited by Dallos PJ, Popper AN, Fay RR.. New York: Springer-Verlag, 1996, p. 435–502. doi:10.1007/978-1-4612-0757-3_8. - DOI
    1. Rajan R. Centrifugal pathways protect hearing sensitivity at the cochlea in noisy environments that exacerbate the damage induced by loud sound. J Neurosci 20: 6684–6693, 2000. doi:10.1523/JNEUROSCI.20-17-06684.2000. - DOI - PMC - PubMed
    1. Goodman SS, Lee C, Guinan JJ Jr, Lichtenhan JT. The spatial origins of cochlear amplification assessed by stimulus-frequency otoacoustic emissions. Biophys J 118: 1183–1195, 2020. doi:10.1016/j.bpj.2019.12.031. - DOI - PMC - PubMed
    1. Shera CA, Guinan JJ. Evoked otoacoustic emissions arise by two fundamentally different mechanisms: a taxonomy for mammalian OAEs. J Acoust Soc Am 105: 782–798, 1999. doi:10.1121/1.426948. - DOI - PubMed

Publication types

LinkOut - more resources