. 2021 Apr 1;125(4):1045-1057.
doi: 10.1152/jn.00676.2020. Epub 2021 Feb 24.

Retinotopic variations of the negative blood-oxygen-level dependent hemodynamic response function in human primary visual cortex

Retinotopic variations of the negative blood-oxygen-level dependent hemodynamic response function in human primary visual cortex

Natasha de la Rosa et al. J Neurophysiol. .

Abstract

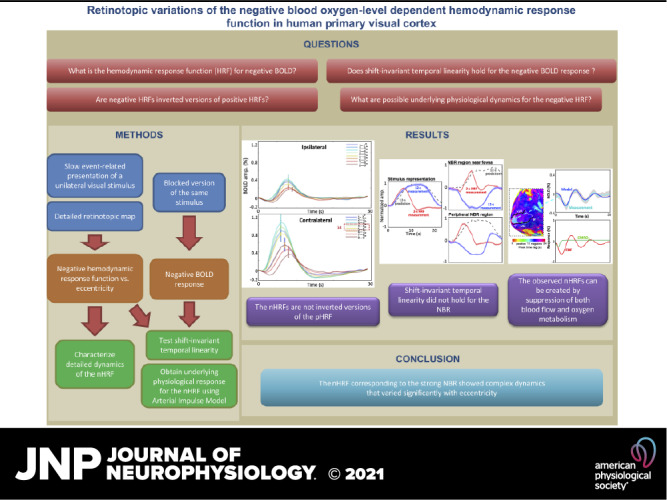
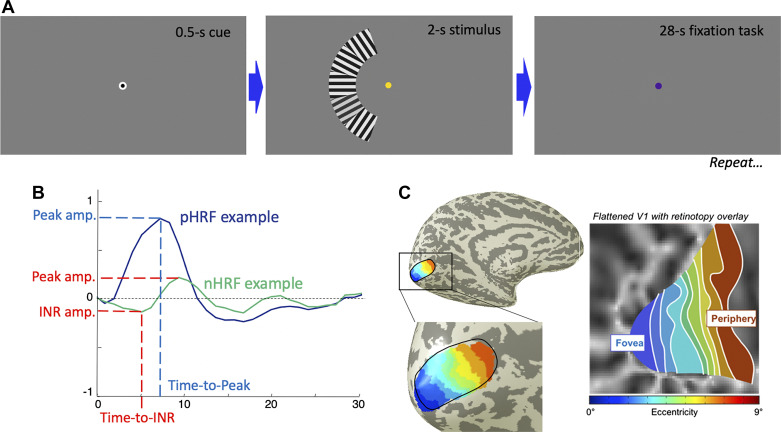
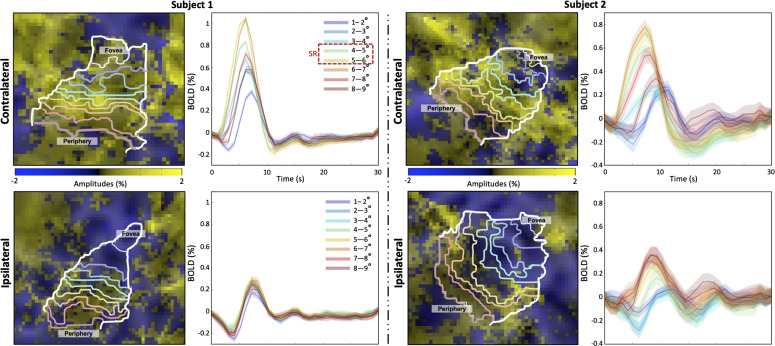
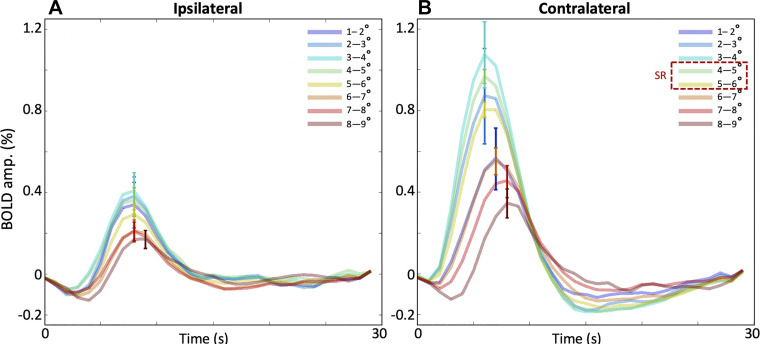
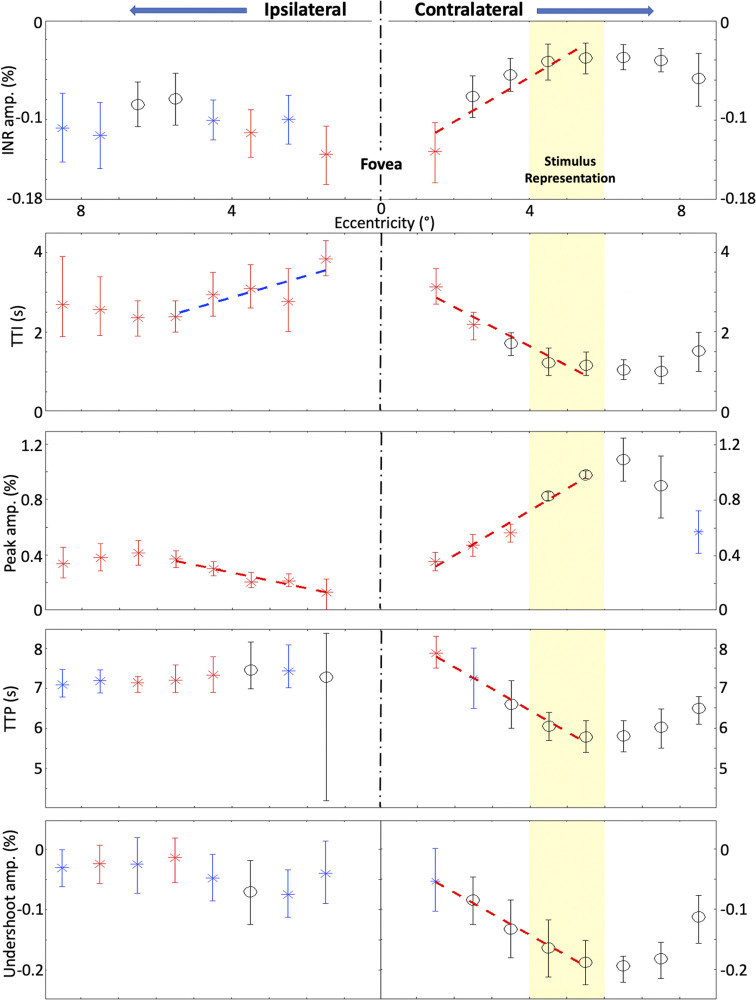
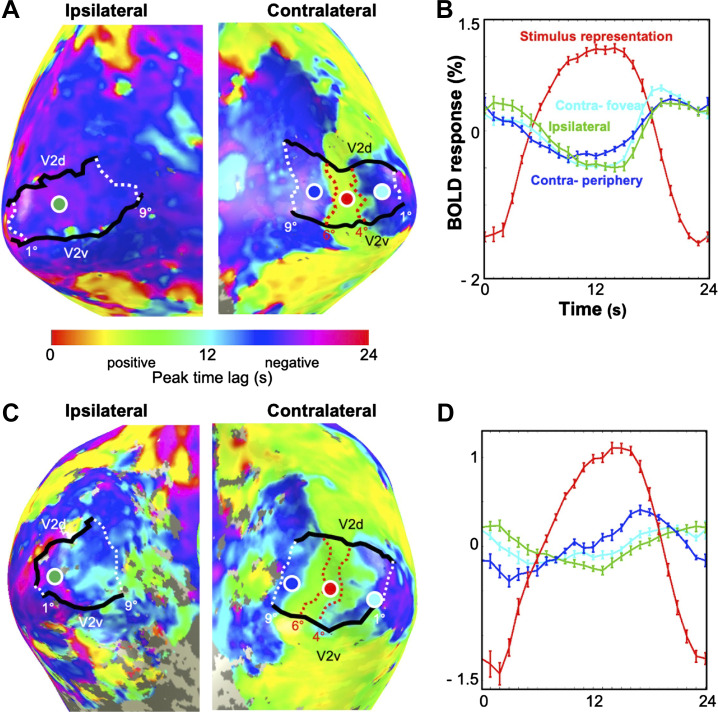
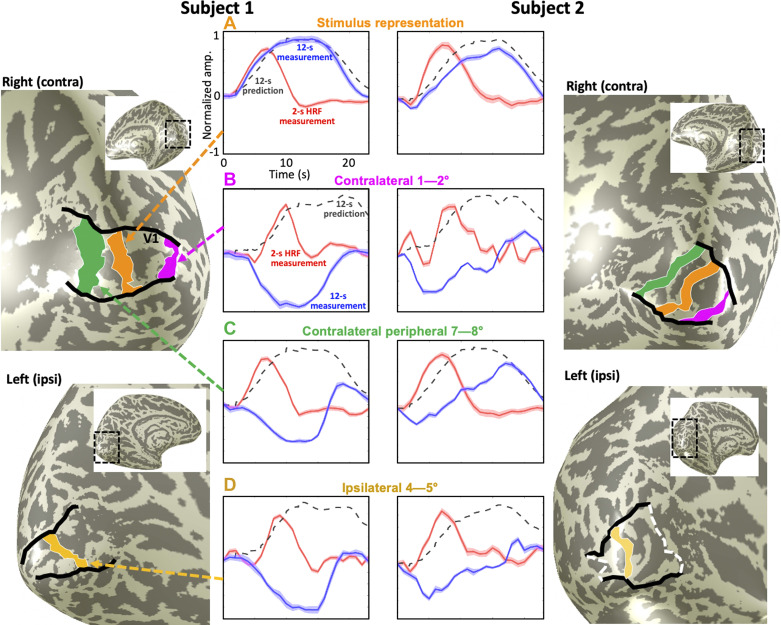
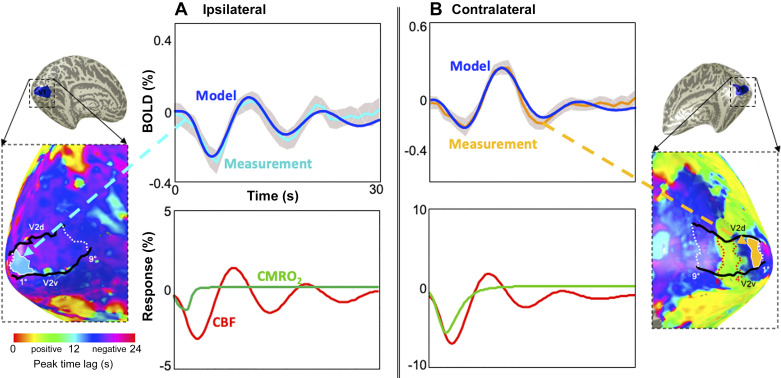
Functional magnetic resonance imaging (fMRI) measures blood-oxygen-level-dependent (BOLD) contrast that is generally assumed to be linearly related to excitatory neural activity. The positive hemodynamic response function (pHRF) is the positive BOLD response (PBR) evoked by a brief neural stimulation; the pHRF is often used as the impulse response for linear analysis of neural excitation. Many fMRI studies have observed a negative BOLD response (NBR) that is often associated with neural suppression. However, the temporal dynamics of the NBR evoked by a brief stimulus, the negative HRF (nHRF), remains unclear. Here, a unilateral visual stimulus was presented in a slow event-related design to elicit both pHRFs in the stimulus representation (SR), and nHRFs elsewhere. The observed nHRFs were not inverted versions of the pHRF previously reported. They were characterized by a stronger initial negative response followed by a significantly later positive peak. In contralateral primary visual cortex (V1), these differences varied with eccentricity from the SR. Similar nHRFs were observed in ipsilateral V1 with less eccentricity variation. Experiments with the blocked version of the same stimulus confirmed that brain regions presenting the unexpected nHRF dynamics correspond to those presenting a strong NBR. These data demonstrated that shift-invariant temporal linearity did not hold for the NBR while confirming that the PBR maintained rough linearity. Modeling indicated that the observed nHRFs can be created by suppression of both blood flow and oxygen metabolism. Critically, the nHRF can be misinterpreted as a pHRF due to their similarity, which could confound linear analysis for event-related fMRI experiments.NEW & NOTEWORTHY We investigate dynamics of the negative hemodynamic response function (nHRF), the negative blood-oxygen-level-dependent (BOLD) response (NBR) evoked by a brief stimulus, in human early visual cortex. Here, we show that the nHRFs are not inverted versions of the corresponding pHRFs. The nHRF has complex dynamics that varied significantly with eccentricity. The results also show shift-invariant temporal linearity does not hold for the NBR.

Keywords: hemodynamic response function; linearity; neural suppression; neurovascular coupling; primary visual cortex.


Conflict of interest statement

No conflicts of interest, financial or otherwise, are declared by the authors.

Figures

None
Graphical abstract
Figure 1.
Figure 1.
A: unilateral stimulus design. A white-on-black dot (0.5 s) cues the subject, followed by presentation of the 2-s duration unilateral stimulus sector. After the main task, the subject performs a color-detection task at fixation. B: amplitude and timing parameters for pHRF and nHRF. C: delineation of 1°-wide eccentricity regions of interest (ROIs) for each hemisphere based on individual retinotopy sessions. nHRF, negative hemodynamic response function; pHRF, positive hemodynamic response function; V1, primary visual cortex.
Figure 2.
Figure 2.
BOLD responses evoked by the slow, event-related design. Top row shows mean activation for contralateral events for two subjects on their respective flat maps. Color overlay shows the strongest absolute amplitude in the range of 2–14 s regardless of its sign; therefore, it is either the peak amplitude (yellow) or INR amplitude (blue) of the HRF at each node. To the right of each flat map are the mean HRF time series corresponding to each of the ROIs. Each color-coded curve represents a different 1° ROI corresponding to the colored ROI boundaries shown on the flat maps. Shaded regions around each curve give the standard error of mean across events. Bottom row shows the same information for the ipsilateral events for the same two subjects. BOLD, blood-oxygen-level-dependent; HRF, hemodynamic response function; INR, initial negative response; ROI, region of interest.
Figure 3.
Figure 3.
Mean HRF time series across all subjects (n =8) for each ROI (A: ipsilateral, B: contralateral). amp., Amplitude; BOLD, blood-oxygen-level-dependent; HRF, hemodynamic response function; ROI, region of interest; SR, stimulus representation.
Figure 4.
Figure 4.
Across-subject HRF parameters versus eccentricity. HRF parameter values extracted from each mean HRF time series. Asterisks show values significantly different from the stimulus representation (red indicates P < 0.01; blue P < 0.05), whereas dashed lines represent significant trends over eccentricities 0°–6° (red indicates P < 0.01; blue P < 0.05). Yellow regions represent the stimulus representation. amp., Amplitude; HRF, hemodynamic response function; INR, initial negative response; TTI, time-to-INR; TTP, time-to-peak.
Figure 5.
Figure 5.
Results of the blocked experiment. A: peak time-lag overlay on early visual cortex for ipsilateral and contralateral hemispheres for subject 1; overlay is thresholded at P < 0.05. Ipsilateral V1 exhibits extensive negative BOLD (time lags > 12 s, cyan-blue colors). Contralateral V1 shows strong positive BOLD (yellow-green colors) within the stimulus representation (SR, 4°–6°, red dotted lines), transitioning to negative BOLD toward the fovea and periphery. B: sample mean time series for a single cycle for subject 1. Red curve corresponds to a 3-mm-wide region denoted by the red dot in the SR. Weaker but still very significant negative BOLD time series are illustrated by the cyan curve that corresponds to the contralateral foveal region, blue curve corresponding to peripheral V1, and green curve from ipsilateral V1. In similar fashion, C shows time-lag overlay and D shows sample mean time series for subject 2. BOLD, blood-oxygen-level-dependent; SR, stimulus representation; V1, primary visual cortex.
Figure 6.
Figure 6.
Examples of temporal linearity test for the BOLD responses in the SR (A), contralateral foveal (B), contralateral peripheral (C), and ipsilateral ROIs (D). The measured BOLD response (blue) evoked by the block design stimulus is compared with the predicted BOLD response (dashed gray) generated by superposing six 2-s HRFs (red). The error bars show 68% confidence intervals. amp., Amplitude; BOLD, blood-oxygen-level-dependent; HRF, hemodynamic response function; ROI, region of interest; SR, stimulus representation; V1, primary visual cortex.
Figure 7.
Figure 7.
Examples of modeling fits (blue) to measured nHRFs in example ROIs: ipsilateral (cyan; A) and contralateral (orange; B); gray-shaded regions show 68% confidence intervals. The ROIs are shown on the mesh with peak time-lag overlay from the blocked experiment to visualize NBR regions. Lower plots show the modeling predictions, CBF (red) and CMRO2 (green), corresponding to the nHRF predictions above (blue). BOLD, blood-oxygen-level-dependent; CBF, cerebral blood flow; CMRO2, cerebral metabolic rate of oxygen; HRF, hemodynamic response function; NBR, negative BOLD response; nHRF, negative HRF; ROI, region of interest.

References

    1. Boynton GM, Engel SA, Glover GH, Heeger DJ. Linear systems analysis of functional magnetic resonance imaging in human V1. J Neurosci 16: 4207–4221, 1996. doi:10.1523/JNEUROSCI.16-13-04207.1996. - DOI - PMC - PubMed
    1. Cohen MS. Parametric analysis of fMRI data using linear systems methods. Neuroimage 6: 93–103, 1997. doi:10.1006/nimg.1997.0278. - DOI - PubMed
    1. Liu Z, Rios C, Zhang N, Yang L, Chen W, He B. Linear and nonlinear relationships between visual stimuli, EEG and BOLD fMRI signals. Neuroimage 50: 1054–1066, 2010. doi:10.1016/j.neuroimage.2010.01.017. - DOI - PMC - PubMed
    1. Logothetis NK, Pauls J, Augath M, Trinath T, Oeltermann A. Neurophysiological investigation of the basis of the fMRI signal. Nature 412: 150–157, 2001. doi:10.1038/35084005. - DOI - PubMed
    1. Bandettini PA, Wong EC, Hinks RS, Tikofsky RS, Hyde JS. Time course EPI of human brain function during task activation. Magn Reson Med 25: 390–397, 1992. doi:10.1002/mrm.1910250220. - DOI - PubMed

Publication types

LinkOut - more resources