. 2021 Feb 24;16(2):e0244599.
doi: 10.1371/journal.pone.0244599. eCollection 2021.

Hurricane impacts on a coral reef soundscape

Affiliations

Hurricane impacts on a coral reef soundscape

Kayelyn R Simmons et al. PLoS One. .

Erratum in

Abstract

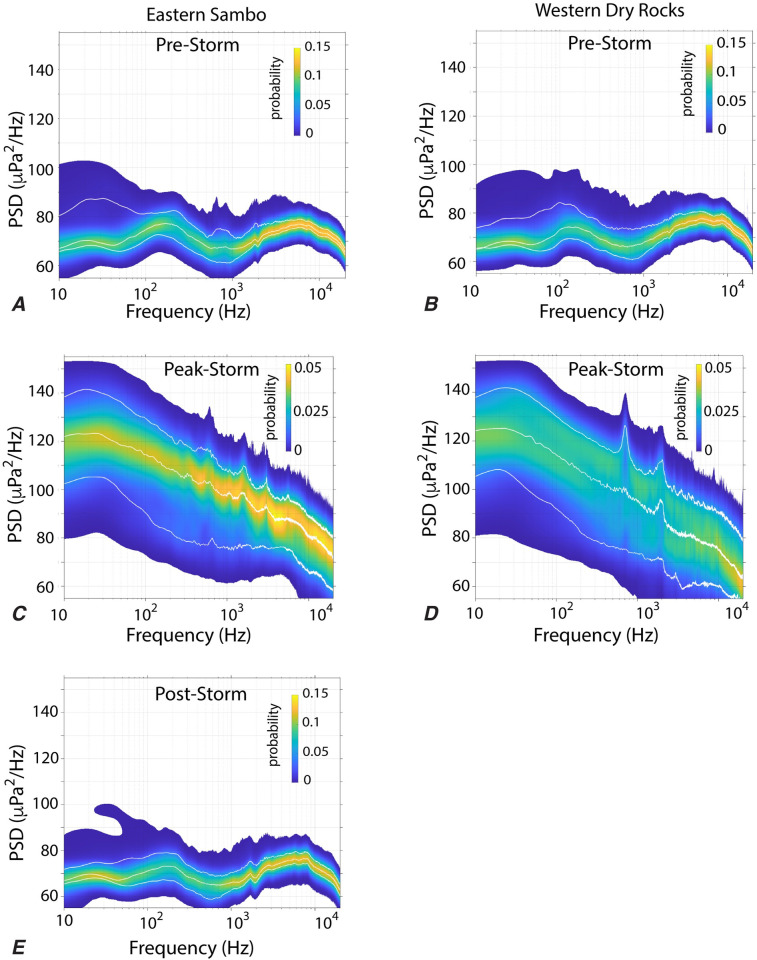
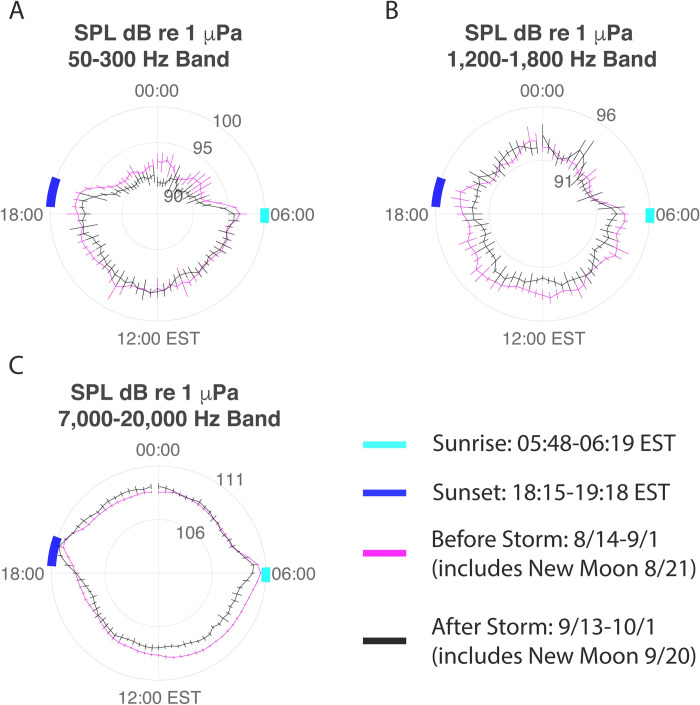
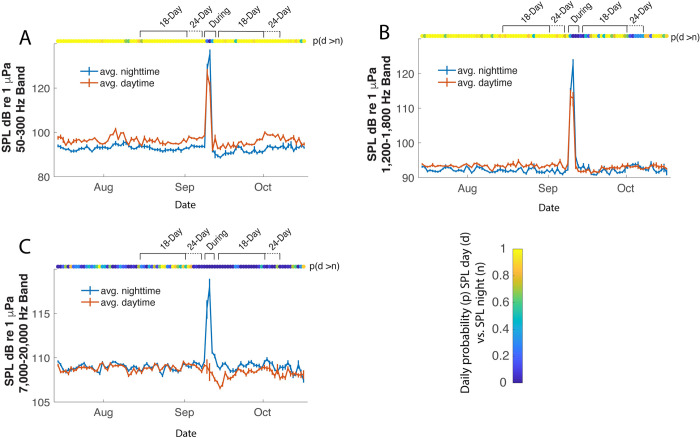
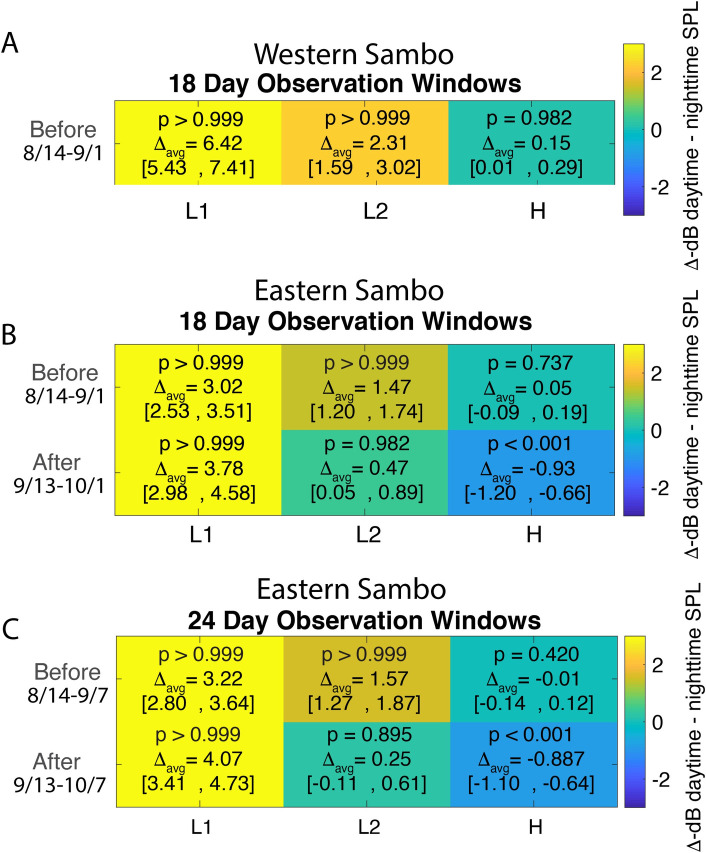
Soundscape ecology is an emerging field in both terrestrial and aquatic ecosystems, and provides a powerful approach for assessing habitat quality and the ecological response of sound-producing species to natural and anthropogenic perturbations. Little is known of how underwater soundscapes respond during and after severe episodic disturbances, such as hurricanes. This study addresses the impacts of Hurricane Irma on the coral reef soundscape at two spur-and-groove fore-reef sites within the Florida Keys USA, using passive acoustic data collected before and during the storm at Western Dry Rocks (WDR) and before, during and after the storm at Eastern Sambo (ESB). As the storm passed, the cumulative acoustic exposure near the seabed at these sites was comparable to a small vessel operating continuously overhead for 1-2 weeks. Before the storm, sound pressure levels (SPLs) showed a distinct pattern of low frequency diel variation and increased high frequency sound during crepuscular periods. The low frequency band was partitioned in two groups representative of soniferous reef fish, whereas the high frequency band represented snapping shrimp sound production. Daily daytime patterns in low-frequency sound production largely persisted in the weeks following the hurricane. Crepuscular sound production by snapping shrimp was maintained post-hurricane with only a small shift (~1.5dB) in the level of daytime vs nighttime sound production for this high frequency band. This study suggests that on short time scales, temporal patterns in the coral reef soundscape were relatively resilient to acoustic energy exposure during the storm, as well as changes in the benthic habitat and environmental conditions resulting from hurricane damage.


Conflict of interest statement

The authors have declared that no competing interests exist.

Figures

Fig 1
Fig 1. Before-after impacts of hurricane Irma on coral reefs in the Florida Keys, with before images taken in August 2017 and after images taken in December 2017.
(A) Brain coral at Eastern Sambo study site taken in August 2017 and (B) its structural damage after Irma in December 2017. (C) Divers observed fish aggregations near and underneath collapsed reef ledges at Looe Key reef (~26 km northeast of Eastern Sambo study site), and the (D) same site with high amounts of reef rubble after Irma. Photo credit K. Simmons.
Fig 2
Fig 2. Study site–FKNMS Zone D.
Sites are denoted by initials: Western Dry Rocks (WDR) is shown in red and Eastern Sambo (ESB) is shown in blue. NOAA wind swath data are shown as contour lines for maximum sustained wind speeds for 2mins/10meters at 34kts (yellow), 50kts (orange), and 64kts (red). Credit: NOAA NHC Best Track Data updated 06/30/2018.
Fig 3
Fig 3. Environmental data.
(A) Barometric pressure data from Sand Key Lighthouse, FL (Station ID SANF1 24.456°N, 81.877°W) NOAA-National Data Buoy Center is shown as a black line with the median (dashed red) and the lower 2.5% confidence interval (solid red). (B) Mean hourly bottom temperature (°C) from hydrophone sensor for Western Dry Rocks (red) and Eastern Sambo (blue). The orange bar represents Hurricane Irma duration and the black arrow indicates the times of landfall at Cudjoe Key FL on September 10, 2017 08:00 EST.
Fig 4
Fig 4. Power Spectral Density (PSD) plot.
Power spectral density plot of Eastern Sambo (left) and Western Dry Rocks (right) pre-storm (A, B), peak-storm (C, D), and post-storm (E). The colors show the probability distribution of the spectral amplitudes, and white lines show the 5, 50, and 95% quantiles of power spectral density as a function of frequency.
Fig 5
Fig 5. Deployment period spectrogram.
Spectrogram displaying the power spectral density (PSD in dB re 1μPa2/Hz) for Western Dry Rocks (A) and Eastern Sambo (B). Frequency bands are denoted as follows: H, high frequency (7,000–20,000Hz); L1 low frequency (50-300Hz); L2 low frequency (1,200–1,800Hz). Open and filled circles indicate the full and new moons respectively. Hurricane Irma made landfall on September 10, 2017. Data within the WDR post-window was not valid or used for quantitative analysis. Spectrogram was generated from the average spectra within each two-minute recording (NFFT = 214, (Δf) = 2.93 Hz).
Fig 6
Fig 6. Short-duration spectrograms from Eastern Sambo.
Spectrograms displaying the low frequency patterns of sound production during 5-day windows around the full moons that occurred (a) before and (b) after the passage of Hurricane Irma. Spectrograms are derived using the average spectra with each two minute recording. Time-axis ticks indicate midnight EST. Sound pressure levels are elevated during daytime hours, relative to the nighttime hours. The daily pattern of sound production reflects the acoustic activity and/or presence of multiple species (see call example in S1 Fig). The diurnal pattern in low-frequency (L1) sound production is present before and after the storm. The diurnal pattern of mid-frequency (L2) sound production is a less pronounced, and appears to weaken after the passage of the storm. Panels on the right show average sound pressure levels during daytime and nighttime recordings averaged over the 5-day windows.
Fig 7
Fig 7. Polar diagram for Eastern Sambo.
Polar diagram of Sound Pressure Levels (SPLs) for ESB for the 18-day observation window before (magenta) and after (black) the hurricane. Means for each recording interval are shown with 3-point moving average. Error bars represent the 68% confidence interval of mean. Data are displayed for A) L1 frequency band (50-300Hz); B) L2 frequency band (1,200–1,800Hz); and C) H frequency band (7,000–20,000Hz). Local sunrise (05:48–06:19 EST) and sunset (18:15–19:18 EST) times during the deployment are shown in cyan and blue, respectively.
Fig 8
Fig 8. Eastern Sambo diurnal patterns.
Mean daytime (red) and nighttime (blue) SPL during the deployment period July 14th–October 15th. Error bars represent the 68% confidence interval for the mean daytime and nighttime SPL within each 24-hour period. Data are displayed for the A) L1 frequency band (50-300Hz); B) L2 frequency band (1,200–1,800Hz); and C) H frequency band (7,000–20,000Hz). The color bar shows probability that daytime SPL is greater than nighttime SPL, p ≈ 1 indicates significantly higher daytime sound levels, and p ≈ 0 indicates significantly higher nighttime sound levels on a given day. Test periods are within an 18-day lunar cycle before the hurricane August 14th–September 1st (includes August 21st new moon) and after the hurricane September 13th–October 1st (includes September 20th new moon).
Fig 9
Fig 9. Pairwise bootstrap analysis results.
Pairwise bootstrap (n = 5000) of mean differences, 95% confidence, and probabilities (p) daytime mean SPL > nighttime mean SPL for 18-day observation window at Western Dry Rocks (A) and Eastern Sambo (B). An additional pairwise analysis is given for Eastern Sambo for 24-day observation window (C). Frequency bands are denoted as follows: L1 low frequency (50-300Hz); L2 low frequency (1,200–1,800Hz); H, high frequency (7,000–20,000Hz). The color-bar represents the change in SPL (dB) between daytime-nighttime paired SPLs, with the 95% confidence range for decibel differences given in brackets. High p values and positive changes in decibel levels indicate periods when the average daytime SPL was higher than average nighttime SPL. Low p values and negative changes in decibel levels indicate periods when the average nighttime SPL was higher than average daytime SPL.

Similar articles

Cited by

References

    1. Swindles GT, Morris PJ, Whitney B, Galloway JM, Gałka M, Gallego-Sala A, et al. Ecosystem shifts during long-term development of an Amazonia peatland. Global Change Biology. 2018; 24(2):738–757. 10.1111/gcb.13950 - DOI - PubMed
    1. Hempson TN, Graham NAJ, MacNeil MA, Hoey AS, Wilson SK. Ecosystem regime shifts disrupt trophic structure. Ecological Applications. 2018; 28(1):191–200. 10.1002/eap.1639 - DOI - PubMed
    1. Lercari D, Defeo O, Ortega L, Orlando L, Gianelli I, Celentano E. Long-term structural and functional changes driven by climate variability and fishery regimes in a sandy beach ecosystem. Ecological Modelling. 2018; 368:41–51. 10.1016/j.ecolmodel.2017.11.007 - DOI
    1. Bevilacqua S, Savonitto G, Lipizer M, Mancuso P, Ciriaco S, Srijemsi M, et al. Climatic anomalies may create a long-lasting ecological phase shift by altering the reproduction of a foundation species. Ecology. 2019; 100(12):e02838 10.1002/ecy.2838 - DOI - PubMed
    1. Graham NAJ, Chong-Seng K, Huchery C, Januchowski-Hartley F, Nash KL. Coral Reef Community Composition in the Context of Disturbance History on the Great Barrier Reef, Australia. PLoS One 2014; 9(7):e101204 10.1371/journal.pone.0101204 - DOI - PMC - PubMed

Publication types