. 2021 Feb 24;16(2):e0246363.
doi: 10.1371/journal.pone.0246363. eCollection 2021.

Antioxidant activity and laxative effects of tannin-enriched extract of Ecklonia cava in loperamide-induced constipation of SD rats

Affiliations

Antioxidant activity and laxative effects of tannin-enriched extract of Ecklonia cava in loperamide-induced constipation of SD rats

Ji Eun Kim et al. PLoS One. .

Abstract

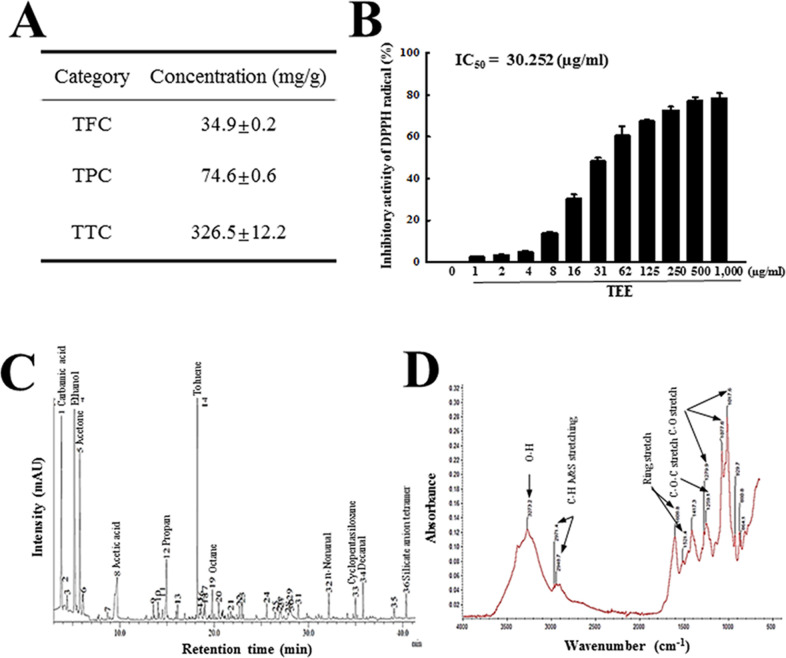
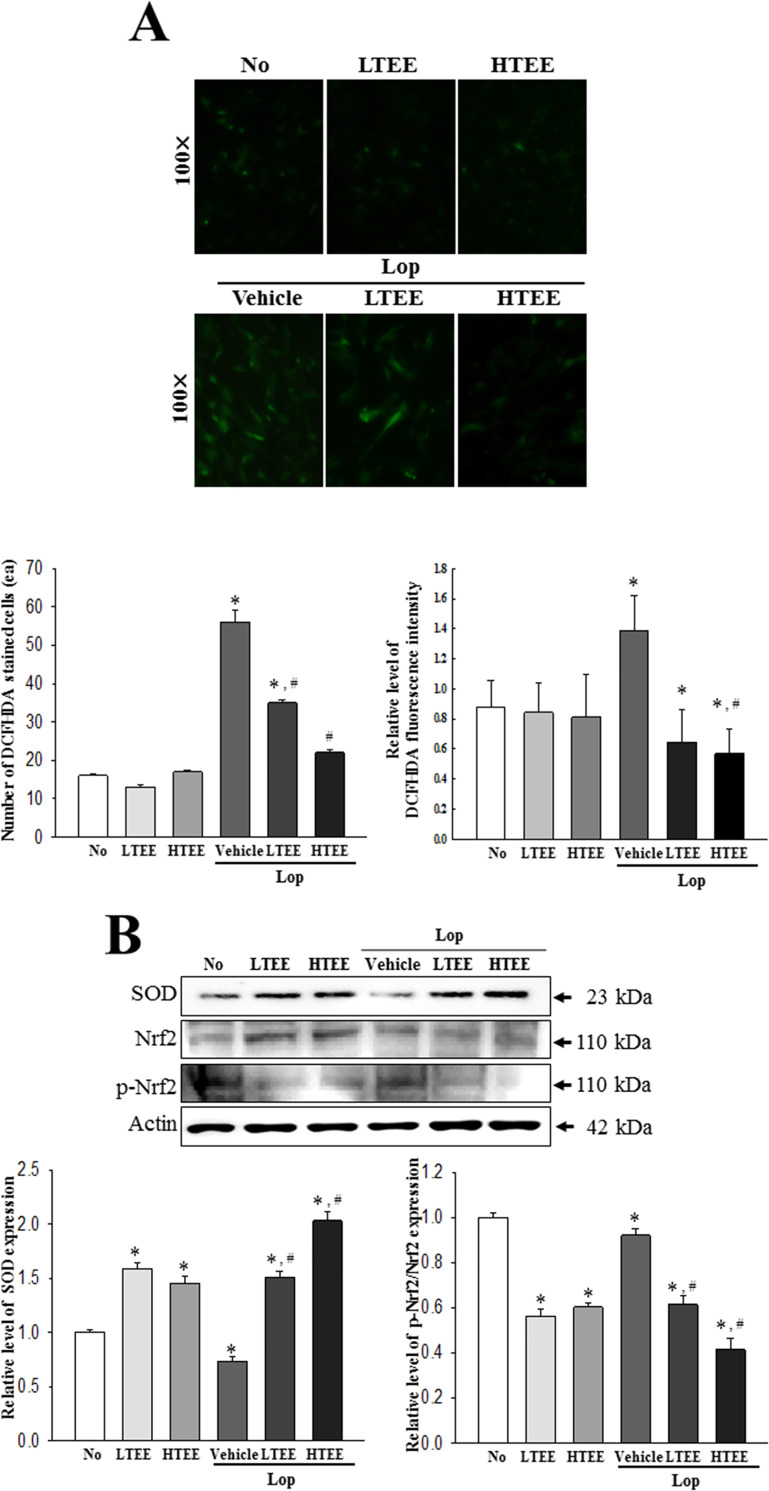
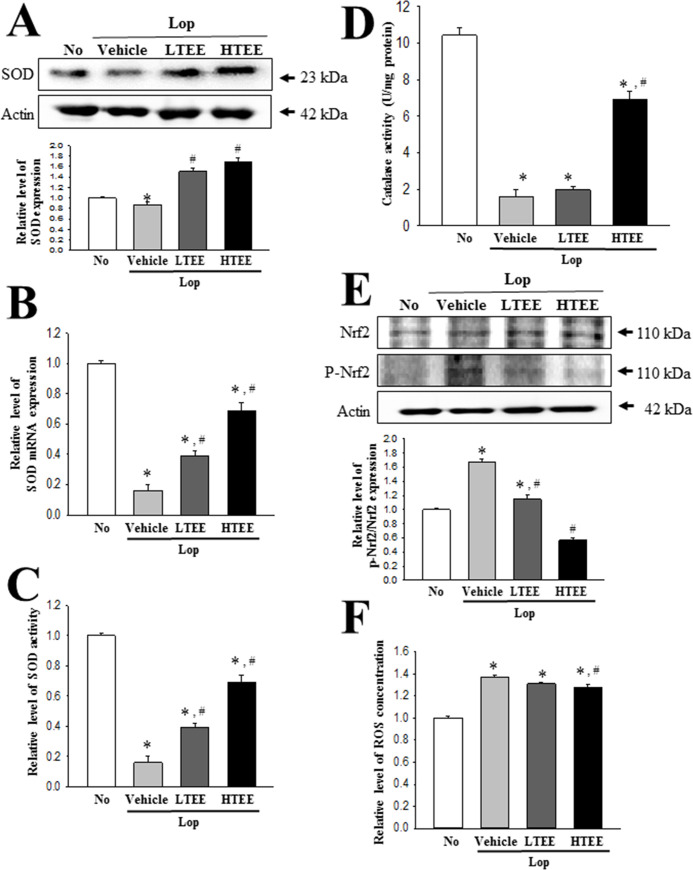
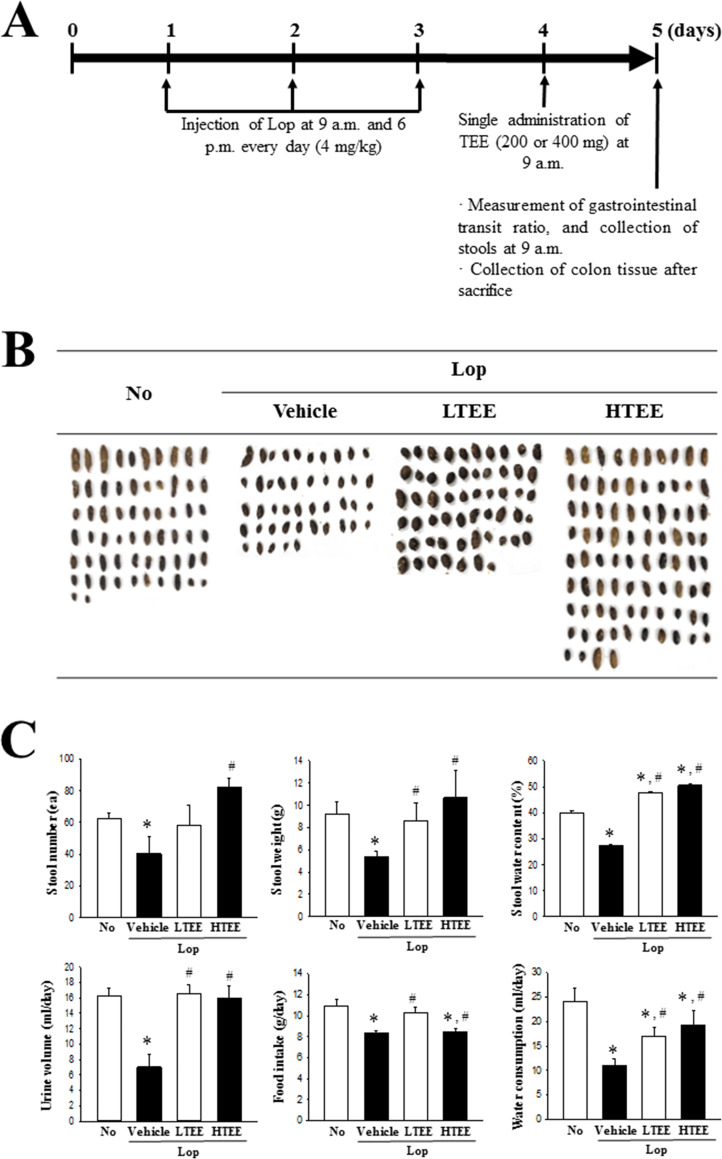
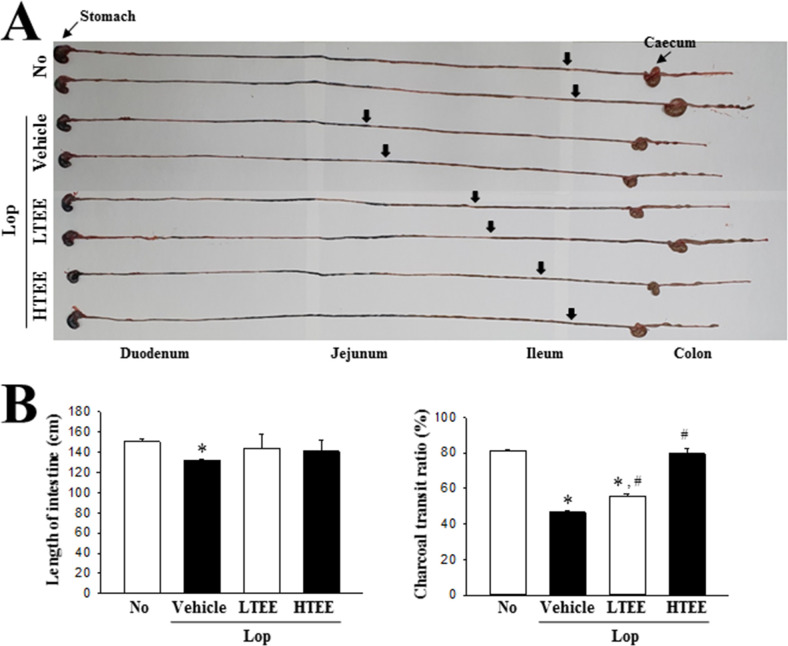
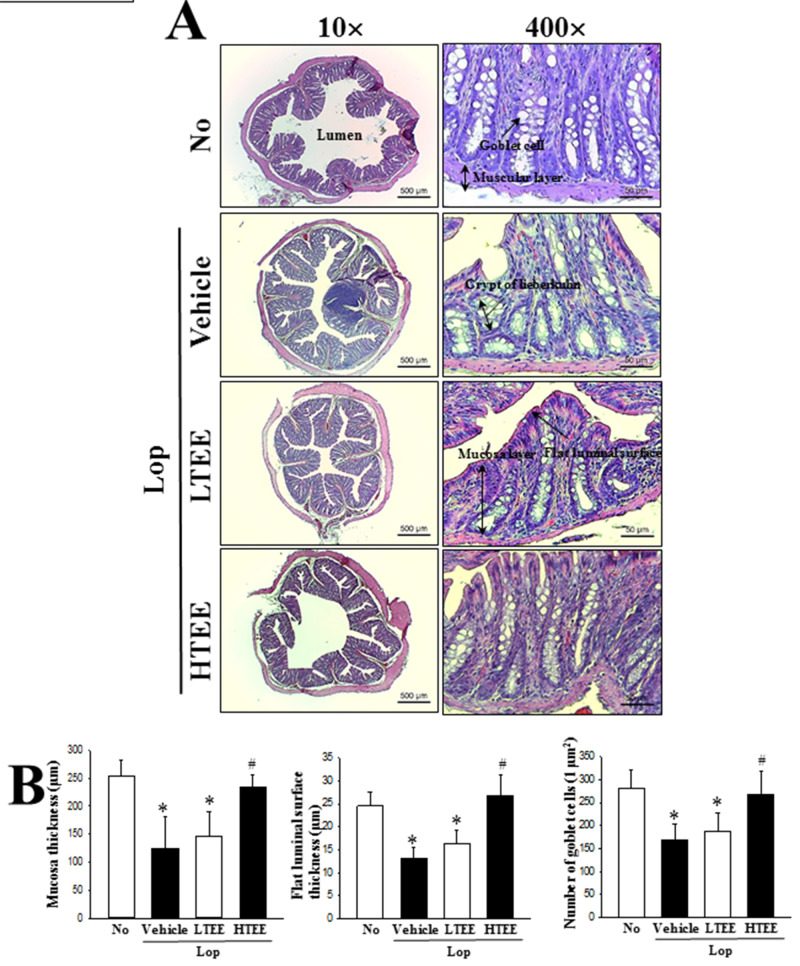
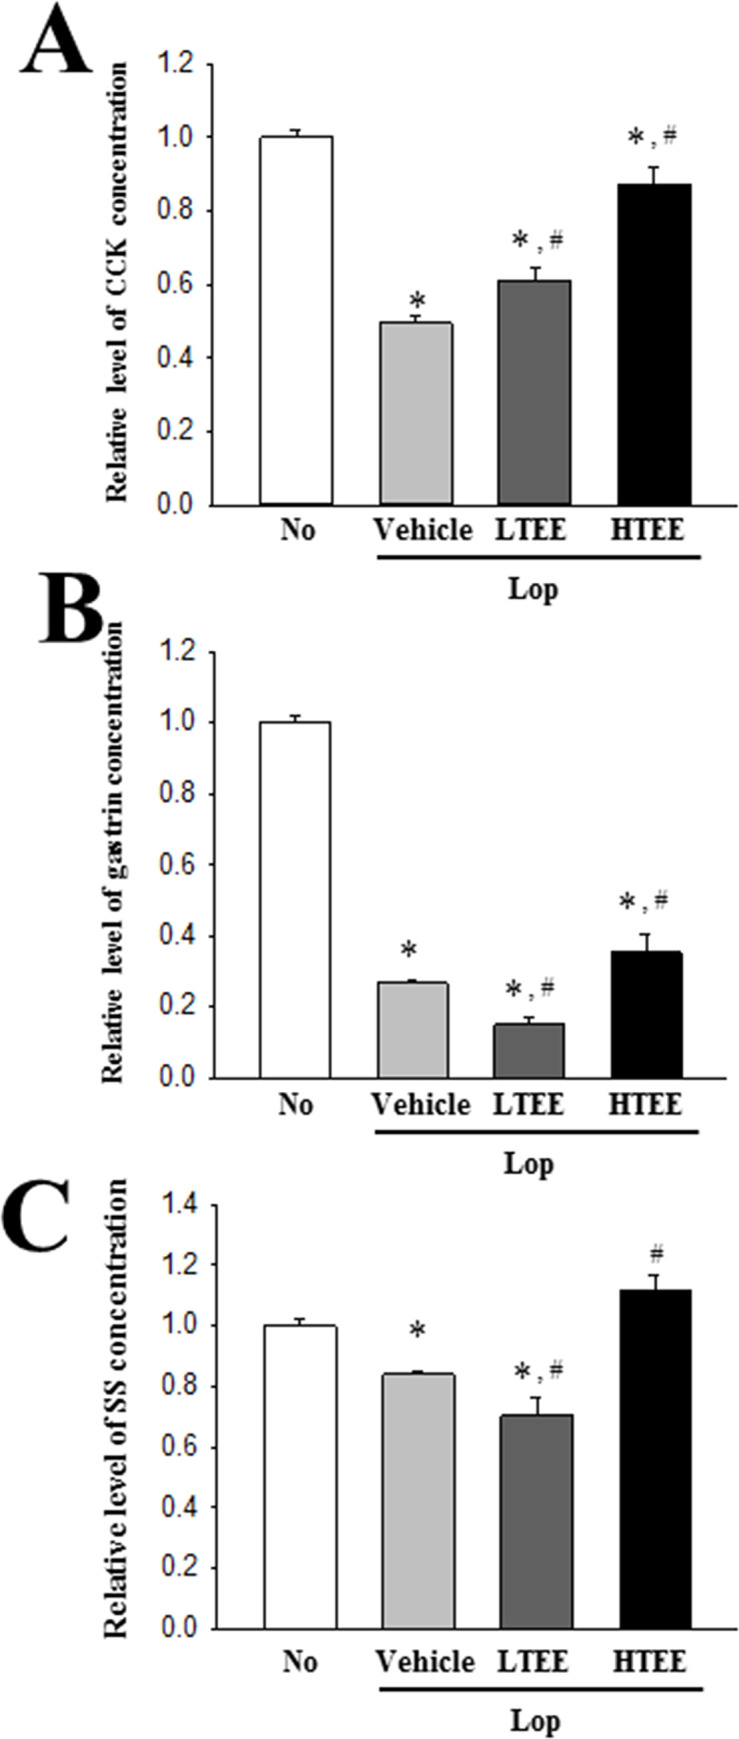
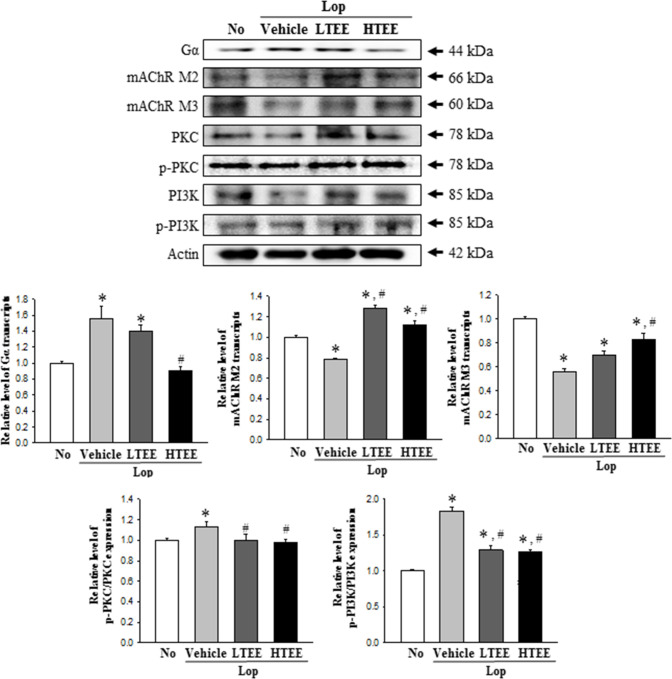
To investigate the role of tannin-enriched extracts of Ecklonia cava (TEE) on the regulation of oxidative balance and laxative activity in chronic constipation, we investigated alterations after exposure to TEE, on constipation phenotypes, muscarinic cholinergic regulation, and oxidative stress responses in the transverse colons of SD rats with loperamide (Lop)-induced constipation. This extract contains high levels of total condensed tannin content (326.5 mg/g), and exhibited high inhibitory activity against 2,2-diphenyl-1-picrylhydrazyl (DPPH) radicals. TEE treatment induced significant improvements in reactive oxygen species (ROS) production, superoxide dismutase (SOD) expression and nuclear factor erythroid 2-related factor 2 (Nrf2) phosphorylation in primary smooth muscles of rat intestine cells (pRISMCs) and transverse colon of constipation model. Also, Lop+TEE treated groups showed alleviated outcomes for the following: most stool parameters, gastrointestinal transit, and intestine length were remarkably recovered; a similar recovery pattern was observed in the histopathological structure, mucin secretion, water channel expression and gastrointestinal hormones secretion in the transverse colon; expressions of muscarinic acetylcholine receptors M2/M3 (mAChR M2/M3) and their mediators on muscarinic cholinergic regulation were significantly recovered. Taken together, these results provide the first evidence that TEE stimulates oxidative stress modulation and muscarinic cholinergic regulation when exerting its laxative effects in chronic constipation models.


Conflict of interest statement

The authors have declared that no competing interests exist.

Figures

Fig 1
Fig 1. Phytochemical composition and component conformation in TEE.
(A) Total flavonoids, phenols and condensed tannin content were analyzed in mixtures containing different concentrations of TEE. (B) Free radical scavenging activity of TEE. DPPH radical scavenging activity was assayed in a mixture containing 0.1 mM DPPH and varied concentrations of TEE (1–1,000 μg/mL). (C) GC-MS spectra of TEE. Major peak in GC/MC chromatogram indicated the name of component. (D) FTIR spectrum of TEE. The functional group of organic compound indicated into major peak. Three samples were assayed in duplicate by DPPH analysis. The data are reported as the mean ± SD. *, p < 0.05 compared with the No treated group. #, p < 0.05 compared with the Lop+Vehicle treated group. Abbreviations: DPPH, 2,2-diphenyl-1-picrylhydrazyl radical; IC50, half maximum inhibitory concentration.
Fig 2
Fig 2. Antioxidant activity of TEE in vitro.
(A) Determination of intracellular ROS production. After DCF-DA treatment into pRISMCs of each subset group, green fluorescence-stained cells were observed and counted using a fluorescent microscope, at 200× magnification. The fluorescence intensity was measured by ELISA reader. (B) Detection of SOD, Nrf2 and p-Nrf2 protein. Total cell lysates were prepared from pRISMCs treated with TEE or Lop+TEE, as described in Materials and Methods. The expression level of three proteins were detected with specific antibodies and quantified using an imaging densitometer. Three samples were assayed in duplicate by DCF-DA staining assay and western blotting. The data are reported as the mean ± SD. *, p < 0.05 compared with the No treated group. #, p < 0.05 compared with the Lop+Vehicle treated group. Abbreviations: ROS, Reactive oxygen species; DCF-DA, 2’,7’-dichlorofluorescein diacetate; SOD, Superoxide dismutase; pRISMCs, primary smooth muscle of rat intestine cells.
Fig 3
Fig 3. Antioxidant activity of TEE in transverse colon of Lop+TEE treated constipation rats.
(A) Detection of SOD proteins. The expression level of SOD was measured by Western blot analysis using specific antibodies. The relative level of this protein in each group was calculated based on the intensity of actin, after calculating the intensity of each band. (B) Determination of SOD activity. The SOD activity level was measured in homogenates of transverse colon tissue collected from each subset group, as described in Materials and Methods. One SOD unit is defined as the amount of enzyme in 20 μL of the sample solution that inhibits the reduction reaction of water-soluble tetrazolium salt-1 (WST-1) with superoxide anion by 50%. (C) Detection of SOD mRNA. The levels of SOD transcripts in the total messenger RNA (mRNA) of brain were measured by RT-qPCR analyses using specific primers. The mRNA level of SOD gene was calculated, based on the intensity of actin as an endogenous control. (D) Detection of Nrf2, and p-Nrf2 protein. The expression level of the two proteins was measured by Western blot analysis using specific antibodies. Subsequently, the phosphorylation level of a specific protein was calculated by dividing the level of phosphorylated proteins by the level of total proteins. (E) Determination of CAT activity. The CAT activity was measured in homogenates of transverse colon collected from each subset group, as described in Materials and Methods. Catalase 1 unit is defined as the amount of enzyme required to decompose 1 μmole of H2O2 per min at pH 7.0 and 25°C. (F) Measurement of ROS concentration. ROS level was measured in homogenates of transverse colon collected from each subset group, as described in Materials and Methods. This assay kit has a detection sensitivity limit of 10 pM for DCF, and 40 nM for H2O2. Four to six rats per group were used in the preparation of total tissue homogenate and total RNA; Western blot analyses, ELISA, RT-PCR analysis were performed in duplicate for each sample. The data are reported as the mean ± SD. *, p<0.05 compared to the No treated group. #, p<0.05 compared to the Lop+Vehicle treated group. Abbreviations: Lop, Loperamide; SOD, Superoxide dismutase; RT-qPCR, Quantitative real time-PCR; CAT, Catalase; ROS, Reactive oxygen species; DCF, 2’,7’-dichlorofluorescein; ELISA, Enzyme-linked immune sorbent assay.
Fig 4
Fig 4. Experimental scheme, and stool parameters and feeding behavior analyses.
(A) Schedule for constipation induction and TEE treatment. After three days of Lop injection, two different doses of TEE were singly administrated at 9 a.m. (B) Stool morphological characteristics. Digital camera images of stools were taken immediately after collection from the metabolic cage. (C) Total number and weight of stools were measured as described in Materials and Methods. Stool water content was calculated using the weight of fresh stools and dried weight. Food intake and water consumption was also calculated using the amount of feed (water) supplied and the amount of feed (water) remaining. Four to six rats per group were used for stool collection, and each parameter was assayed in duplicate. The data are reported as the mean ± SD. *, p < 0.05 compared with the No treated group. #, p < 0.05 compared with the Lop+Vehicle treated group. Abbreviation: Lop, Loperamide.
Fig 5
Fig 5. GI transit ratio and intestinal length in Lop+TEE treated constipation rats.
(A) Actual image showing the charcoal meal transit and intestine. The total intestinal tract was excised from a rat of each subset group treated with charcoal meal powder. Morphology was observed using a digital camera. The arrows indicate position of the charcoal meal. (B) Transit ratio of the charcoal meal and the length of intestine. The total distance travelled by the charcoal meal from the pylorus was measured. The charcoal meal transit ratio was then calculated using total length of the intestine and distance of the charcoal meal. Four to six rats per group were used in the GI transit ratio test, and the charcoal meal transit distance and intestine length were measured in duplicate. The data are reported as the mean ± SD. *, p < 0.05 compared to the No treated group. #, p < 0.05 compared to the Lop + Vehicle-treated group. Abbreviations: GI, Gastrointestinal; Lop, Loperamide.
Fig 6
Fig 6. Histopathological structures of transverse colon in Lop+TEE treated constipation rats.
(A) H&E stained sections of transverse colon from the No, Lop+Vehicle, Lop+LTEE or Lop+HTEE treated groups were observed at 40× (left column) and 400× (right column) using a light microscope. (B) Histopathological parameters were determined using the Leica Application Suite. Four to six rats per group were used in the preparation of H&E stained slide, and the histopathological parameters were measured in duplicate in each slide. The data are reported as the mean ± SD. *, p<0.05 compared to the No treated group. #, p<0.05 compared to the Lop+Vehicle treated group. Abbreviations: H&E, Hematoxylin and eosin; Lop, Loperamide.
Fig 7
Fig 7. Mucin secretion and membrane water channel expression in Lop+TEE treated constipation rats.
(A) Detection of mucin in Alcian blue stained transverse colon tissue. Mucin secreted from crypt layer cells was stained with Alcian blue at pH 2.5, and images were observed at 100× magnification. Four to six rats per group were used in the preparation of tissue slide, and Alcian blue staining analysis was performed in duplicate in each slide. (B) RT-qPCR analyses for MUC2, AQP3 and AQP8. The levels of MUC2, AQP3 and AQP8 transcripts in the total mRNA of transverse colons were measured by RT-qPCR using specific primers. The mRNA levels of three genes were calculated, based on the intensity of actin as an endogenous control. Four to six rats per group were used the preparation of total RNA, RT-qPCR analyses were assayed in duplicate for each sample. The data are reported as the mean ± SD. *, p<0.05 compared to the No treated group. #, p<0.05 compared to the Lop+Vehicle treated group. Abbreviations: Lop, Loperamide; RT-qPCR, Quantitative real time-PCR; MUC2, Mucin 2; AQP, Aquaporin.
Fig 8
Fig 8. Concentrations of GI hormones in Lop+TEE treated constipation rats.
The concentration of (A) CCK, (B) gastrin, and (C) SS was measured in the transverse colon homogenate by an enzyme-linked immunosorbent assay. The minimum detectable concentration of each kit is 0.1–1,000 pg/mL of CCK, 0.312–20 pg/mL of gastrin, and 4.7–300 pg/mL of SS. Five to six rats per group were used in preparation of tissue homogenate, and hormone level was assayed in duplicate in each sample. The data are reported as the mean ± SD. *, p<0.05 compared to the No treated group. #, p<0.05 compared to the Lop+Vehicle treated group. Abbreviations: Lop, Loperamide; GI, Gastrointestinal; CCK, Cholecystokinin; SS, somatostatin.
Fig 9
Fig 9. Expressions of mAChRs and key mediators within their downstream signaling pathway in Lop+TEE treated constipation rats.
Expression levels of mAChRs and key mediators, including mAChR M2, mAChR M3, Gα, PKC, p-PKC, PI3K and p-PI3K, in the mAChR M2 and M3 signaling pathway were measured by Western blot analysis using specific primary antibodies and HRP-labeled anti-rabbit IgG antibody. After the intensity of each band was determined using an imaging densitometer, relative levels of the seven proteins were calculated based on the intensity of actin. Four to six rats per group were used in the preparation of the total tissue homogenate, and Western blot analyses were assayed in duplicate in each sample. The data are reported as the mean ± SD. *, p<0.05 compared to the No treated group. #, p<0.05 compared to the Lop+Vehicle treated group. Abbreviations: Lop, Loperamide; mAChR, muscarinic acetylcholine receptors; PKC, Protein kinase C; PI3K, Phosphoinositide 3-kinases; HRP, Horseradish peroxidase; IgG, Immunoglobulin G.

References

    1. Pizzino G, Irrera N, Cucinotta M, Pallio G, Mannino F, Arcoraci V, et al. Oxidative stress: harms and benefits for human health. Oxid Med Cell Longev. 2017;2017: 8416763 10.1155/2017/8416763 - DOI - PMC - PubMed
    1. Vermorken A, Andrès E, Cui Y. Chronic constipation-a warning sign for oxidative stress? Aliment Pharmacol Ther. 2015;42: 385–386. 10.1111/apt.13257 - DOI - PubMed
    1. Zhou JF, Lou JG, Zhou SL, Wang JY. Potential oxidative stress in children with chronic constipation. World J Gastroenterol. 2005;11: 368–371. 10.3748/wjg.v11.i3.368 - DOI - PMC - PubMed
    1. Li Y, Zong Y, Qi J, Liu K. Prebiotics and oxidative stress in constipated rats. J Pediatr Gastroenterol Nutr. 2011;53: 447–452. 10.1097/MPG.0b013e31821eed83 - DOI - PubMed
    1. Jabri MA, Wannes D, Hajji N, Sakly M, Marzouki L, Sebai H. Role of laxative and antioxidant properties of Malva sylvestris leaves in constipation treatment. Biomed Pharmacother. 2017;89: 29–35. 10.1016/j.biopha.2017.02.020 - DOI - PubMed

Publication types