. 2021 Jun;254(2):173-184.
doi: 10.1002/path.5653. Epub 2021 Mar 30.

Machine learning-based analysis of alveolar and vascular injury in SARS-CoV-2 acute respiratory failure

Affiliations

Machine learning-based analysis of alveolar and vascular injury in SARS-CoV-2 acute respiratory failure

Fiorella Calabrese et al. J Pathol. 2021 Jun.

Abstract

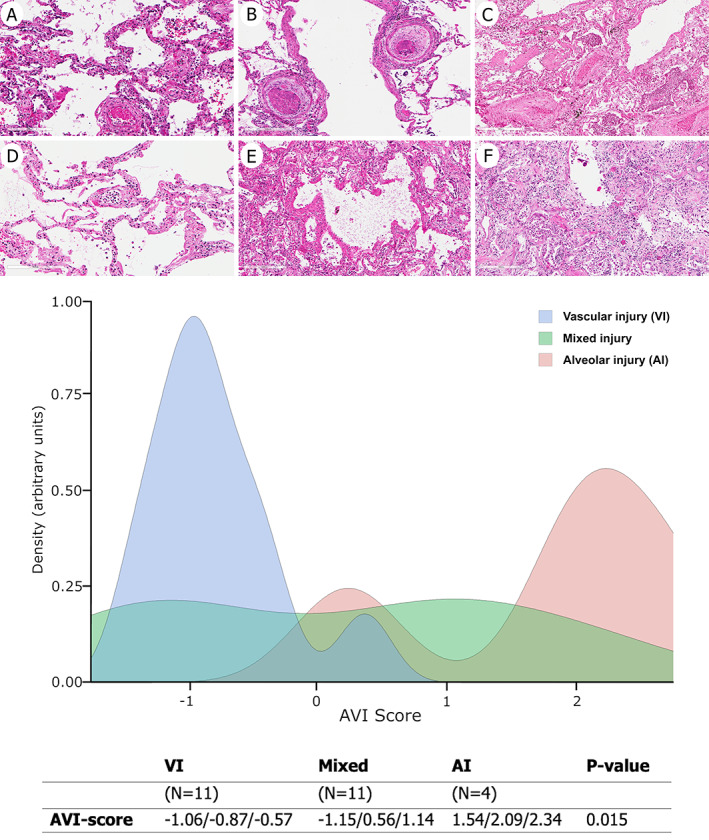
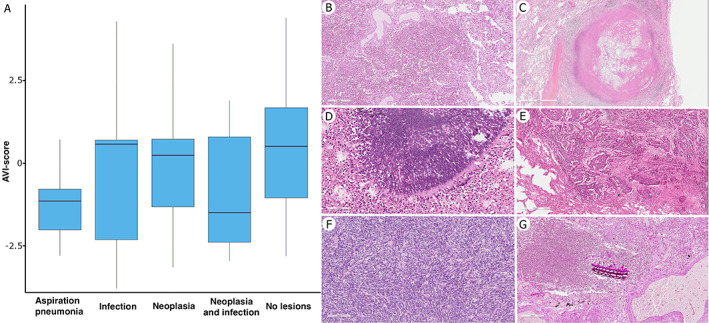
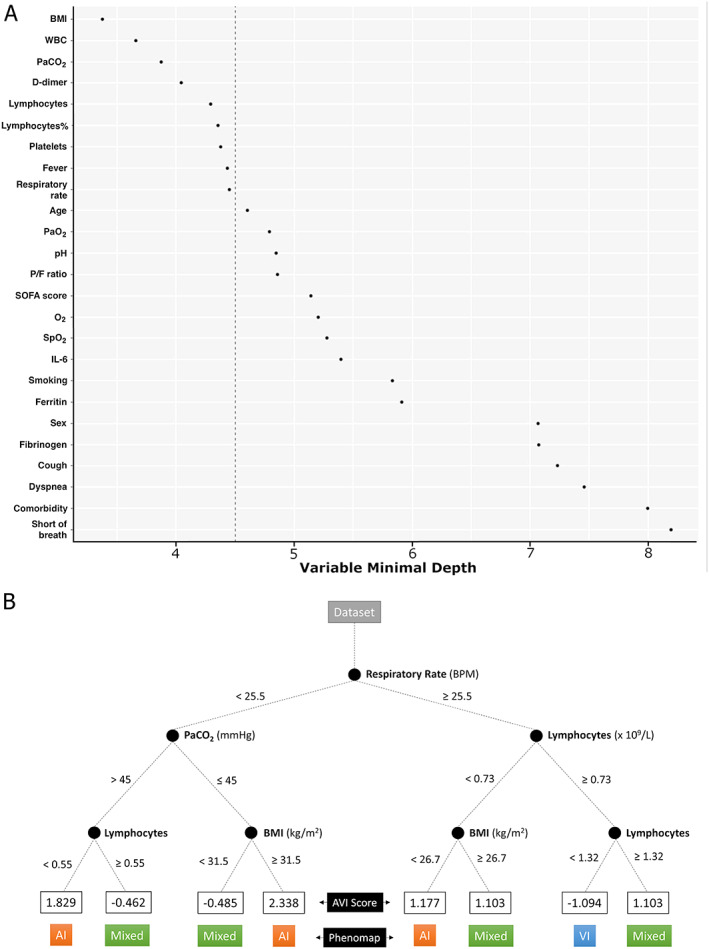
Severe acute respiratory syndrome-coronavirus-2 (SARS-CoV-2) pneumopathy is characterized by a complex clinical picture and heterogeneous pathological lesions, both involving alveolar and vascular components. The severity and distribution of morphological lesions associated with SARS-CoV-2 and how they relate to clinical, laboratory, and radiological data have not yet been studied systematically. The main goals of the present study were to objectively identify pathological phenotypes and factors that, in addition to SARS-CoV-2, may influence their occurrence. Lungs from 26 patients who died from SARS-CoV-2 acute respiratory failure were comprehensively analysed. Robust machine learning techniques were implemented to obtain a global pathological score to distinguish phenotypes with prevalent vascular or alveolar injury. The score was then analysed to assess its possible correlation with clinical, laboratory, radiological, and tissue viral data. Furthermore, an exploratory random forest algorithm was developed to identify the most discriminative clinical characteristics at hospital admission that might predict pathological phenotypes of SARS-CoV-2. Vascular injury phenotype was observed in most cases being consistently present as pure form or in combination with alveolar injury. Phenotypes with more severe alveolar injury showed significantly more frequent tracheal intubation; longer invasive mechanical ventilation, illness duration, intensive care unit or hospital ward stay; and lower tissue viral quantity (p < 0.001). Furthermore, in this phenotype, superimposed infections, tumours, and aspiration pneumonia were also more frequent (p < 0.001). Random forest algorithm identified some clinical features at admission (body mass index, white blood cells, D-dimer, lymphocyte and platelet counts, fever, respiratory rate, and PaCO2 ) to stratify patients into different clinical clusters and potential pathological phenotypes (a web-app for score assessment has also been developed; https://r-ubesp.dctv.unipd.it/shiny/AVI-Score/). In SARS-CoV-2 positive patients, alveolar injury is often associated with other factors in addition to viral infection. Identifying phenotypical patterns at admission may enable a better stratification of patients, ultimately favouring the most appropriate management. © 2021 The Pathological Society of Great Britain and Ireland. Published by John Wiley & Sons, Ltd.

Keywords: COVID-19; SARS-CoV-2; acute respiratory failure; alveolar injury; vascular injury.


Figures

Figure 1
Figure 1
ROC analysis indicates a cut‐off of about zero (−0.034) with an overall accuracy of 0.97 (95% CI 0.91–1.00), sensitivity 0.91 (95% CI 0.74–1.00), and specificity equal to 1.00 to discriminate between AI and VI patients. The mixed phenotype is not characterized by specific ranges of the AVI score. Data in the table are medians (I, III quartile). P value refers to the overall difference among phenotypes. At the top of the figure, example histopathological sections of case 1 (VI phenotype, A, D), case 11 (mixed phenotype, B, E), and case 5 (AI phenotype, C, F) with the most representative lesions in both upper (A–C) and lower lobes (D–F) are shown. (A) Capillaritis and microthrombus (H&E stain). (B) Microthrombi (H&E stain). (C) Hyaline membrane with squamous metaplasia (H&E stain). (D) Neutrophilic margination and capillary inflammation (H&E stain). (E) Diffuse hyaline membrane (H&E stain). (F) Organizing pneumonia (H&E stain). Original magnification: (A, B) ×200; (C–F) ×100.
Figure 2
Figure 2
Correlation of AVI score with (A) length of intubation (R 2 0.63), (B) ICU stay (R 2 0.72), (C) hospital stay (R 2 0.49) and symptom duration (R 2 0.67), and (D) viral quantity (R 2 0.49 for AI, 0.01 for VI, and 0.33 for mixed). Log(2−ΔCt) represents the SARS‐CoV‐2 relative loads (ratios of viral target to human target) transformed to logarithmic scale for graphical representation.
Figure 3
Figure 3
(A) Correlation of AVI score with other pathological lesions. (B–G) On the right, the most representative histological sections of the pathological lesions detected: inflammatory exudate within the intra‐alveolar space resulting in lobar pneumonia (B, H&E stain); necrotizing granuloma (C, H&E stain); pulmonary aspergillosis (D, H&E stain); squamous cell carcinoma (E, H&E stain); lung metastasis of pleural malignant solitary fibrous tumour, previously diagnosed (F, H&E stain); and aspiration pneumonia with inhaled foreign body (G, PAS stain). Original magnification: (D) ×200; (F, G) ×100; (B, E) ×50; (C) ×15.
Figure 4
Figure 4
Variables characterizing AVI score. (A) A random forest‐based model was used to obtain the most important variables able to sort patients based on the previous robust principal component analysis (RPCA). The relative importance of each clinical variable against the score derived via RPCA was measured by the minimal depth of variables: the smaller the minimal depth, the more important the variable. Important variables are reported in rank order with the most important at the top. The vertical dashed line indicates a threshold corresponding to the maximal–minimal depth for important variables (left side of the panel). Variables exceeding this value are considered unimportant. (B) Phenomapped representation of the random forest algorithm (pruned version) to show how patients were classified to a specific AVI score based on the most important clinical characteristics. The final node number represents values of the AVI score for specific patterns of covariates.

References

    1. Wang D, Hu B, Hu C, et al. Clinical characteristics of 138 hospitalized patients with 2019 novel coronavirus‐infected pneumonia in Wuhan, China. JAMA 2020; 323: 1061–1069. - PMC - PubMed
    1. Porcheddu R, Serra C, Kelvin D, et al. Similarity in case fatality rates (CFR) of COVID‐19/SARS‐COV‐2 in Italy and China. J Infect Dev Ctries 2020; 14: 125–128. - PubMed
    1. Longhini F, Bruni A, Garofalo E, et al. Helmet continuous positive airway pressure and prone positioning: a proposal for an early management of COVID‐19 patients. Pulmonology 2020; 26: 186–191. - PMC - PubMed
    1. Yang X, Yu Y, Xu J, et al. Clinical course and outcomes of critically ill patients with SARS‐CoV‐2 pneumonia in Wuhan, China: a single‐centered, retrospective, observational study. Lancet Respir Med 2020; 8: 475–481. - PMC - PubMed
    1. Tzotzos SJ, Fischer B, Fischer H, et al. Incidence of ARDS and outcomes in hospitalized patients with COVID‐19: a global literature survey. Crit Care 2020; 24: 516. - PMC - PubMed

Publication types