Age-associated mitochondrial complex I deficiency is linked to increased stem cell proliferation rates in the mouse colon
- PMID: 33626245
- PMCID: PMC7963326
- DOI: 10.1111/acel.13321
Age-associated mitochondrial complex I deficiency is linked to increased stem cell proliferation rates in the mouse colon
Abstract
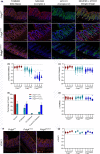
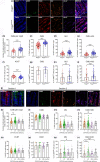
One of the hallmarks of aging is an accumulation of cells with defects in oxidative phosphorylation (OXPHOS) due to mutations of mitochondrial DNA (mtDNA). Rapidly dividing tissues maintained by stem cells, such as the colonic epithelium, are particularly susceptible to accumulation of OXPHOS defects over time; however, the effects on the stem cells are unknown. We have crossed a mouse model in which intestinal stem cells are labelled with EGFP (Lgr5-EGFP-IRES-creERT2) with a model of accelerated mtDNA mutagenesis (PolgAmut/mut ) to investigate the effect of OXPHOS dysfunction on colonic stem cell proliferation. We show that a reduction in complex I protein levels is associated with an increased rate of stem cell cycle re-entry. These changes in stem cell homeostasis could have significant implications for age-associated intestinal pathogenesis.
Keywords: aging; colon; complex I; mitochondria; stem cells.
© 2021 The Authors. Aging Cell published by the Anatomical Society and John Wiley & Sons Ltd.
Conflict of interest statement
The authors declare no competing financial interests.
Figures


Similar articles
-
Mitochondrial complex I subunit deficiency promotes pancreatic α-cell proliferation.Mol Metab. 2022 Jun;60:101489. doi: 10.1016/j.molmet.2022.101489. Epub 2022 Apr 4. Mol Metab. 2022. PMID: 35390502 Free PMC article.
-
Mitochondrial dysfunction impairs osteogenesis, increases osteoclast activity, and accelerates age related bone loss.Sci Rep. 2020 Jul 15;10(1):11643. doi: 10.1038/s41598-020-68566-2. Sci Rep. 2020. PMID: 32669663 Free PMC article.
-
The striatum is highly susceptible to mitochondrial oxidative phosphorylation dysfunctions.J Neurosci. 2011 Jul 6;31(27):9895-904. doi: 10.1523/JNEUROSCI.6223-10.2011. J Neurosci. 2011. PMID: 21734281 Free PMC article.
-
Mouse models for nuclear DNA-encoded mitochondrial complex I deficiency.J Inherit Metab Dis. 2011 Apr;34(2):293-307. doi: 10.1007/s10545-009-9005-x. Epub 2010 Jan 27. J Inherit Metab Dis. 2011. PMID: 20107904 Review.
-
Vitamin D and the nutritional environment in functions of intestinal stem cells: Implications for tumorigenesis and prevention.J Steroid Biochem Mol Biol. 2020 Apr;198:105556. doi: 10.1016/j.jsbmb.2019.105556. Epub 2019 Nov 26. J Steroid Biochem Mol Biol. 2020. PMID: 31783155 Free PMC article. Review.
Cited by
-
Expression of Oxidative Phosphorylation Complexes and Mitochondrial Mass in Pediatric and Adult Inflammatory Bowel Disease.Oxid Med Cell Longev. 2022 Jan 6;2022:9151169. doi: 10.1155/2022/9151169. eCollection 2022. Oxid Med Cell Longev. 2022. PMID: 35035669 Free PMC article.
-
Fut2 Deficiency Promotes Intestinal Stem Cell Aging by Damaging Mitochondrial Functions via Down-Regulating α1,2-Fucosylation of Asah2 and Npc1.Research (Wash D C). 2024 Mar 27;7:0343. doi: 10.34133/research.0343. eCollection 2024. Research (Wash D C). 2024. PMID: 38550777 Free PMC article.
-
Cell reprogramming shapes the mitochondrial DNA landscape.Nat Commun. 2021 Sep 2;12(1):5241. doi: 10.1038/s41467-021-25482-x. Nat Commun. 2021. PMID: 34475388 Free PMC article.
-
Mitochondrial DNA mutations in ageing and cancer.Mol Oncol. 2022 Sep;16(18):3276-3294. doi: 10.1002/1878-0261.13291. Epub 2022 Jul 28. Mol Oncol. 2022. PMID: 35842901 Free PMC article. Review.
-
Mitochondrial complex I subunit deficiency promotes pancreatic α-cell proliferation.Mol Metab. 2022 Jun;60:101489. doi: 10.1016/j.molmet.2022.101489. Epub 2022 Apr 4. Mol Metab. 2022. PMID: 35390502 Free PMC article.
References
-
- Ahlqvist, K. J. , Hämäläinen, R. H. , Yatsuga, S. , Uutela, M. , Terzioglu, M. , Götz, A. , Forsström, S. , Salven, P. , Angers‐Loustau, A. , Kopra, O. H. , Tyynismaa, H. , Larsson, N.‐G. , Wartiovaara, K. , Prolla, T. , Trifunovic, A. , & Suomalainen, A. (2012). Somatic progenitor cell vulnerability to mitochondrial DNA mutagenesis underlies progeroid phenotypes in polg mutator mice. Cell Metabolism, 15(1), 100–109. 10.1016/j.cmet.2011.11.012 - DOI - PubMed
-
- Baines, H. L. , Stewart, J. B. , Stamp, C. , Zupanic, A. , Kirkwood, T. B. , Larsson, N. G. , Turnbull, D. M. , & Greaves, L. C. (2014). Similar patterns of clonally expanded somatic mtDNA mutations in the colon of heterozygous mtDNA mutator mice and ageing humans. Mechanisms of Ageing and Development, 139c, 22–30. 10.1016/j.mad.2014.06.003 - DOI - PMC - PubMed
-
- Barker, N. , van Es, J. H. , Kuipers, J. , Kujala, P. , van den Born, M. , Cozijnsen, M. , Haegebarth, A. , Korving, J. , Begthel, H. , Peters, P. J. , & Clevers, H. (2007). Identification of stem cells in small intestine and colon by marker gene Lgr5. Nature, 449(7165), 1003–1007.nature06196 [pii] 10.1038/nature06196 - DOI - PubMed
-
- Barriga, F. M. , Montagni, E. , Mana, M. , Mendez‐Lago, M. , Hernando‐Momblona, X. , Sevillano, M. , Guillaumet‐Adkins, A. , Rodriguez‐Esteban, G. , Buczacki, S. J. A. , Gut, M. , Heyn, H. , Winton, D. J. , Yilmaz, O. H. , Attolini, C. S. , Gut, I. , & Batlle, E. (2017). Mex3a marks a slowly dividing subpopulation of Lgr5+ intestinal stem cells. Cell Stem Cell, 20(6), 801–816e807. 10.1016/j.stem.2017.02.007 - DOI - PMC - PubMed
-
- Chen, M. L. , Logan, T. D. , Hochberg, M. L. , Shelat, S. G. , Yu, X. , Wilding, G. E. , Tan, W. , Kujoth, G. C. , Prolla, T. A. , Selak, M. A. , Kundu, M. , Carroll, M. , & Thompson, J. E. (2009). Erythroid dysplasia, megaloblastic anemia, and impaired lymphopoiesis arising from mitochondrial dysfunction. Blood, 114(19), 4045–4053. 10.1182/blood-2008-08-169474 - DOI - PMC - PubMed
Publication types
MeSH terms
Substances
Supplementary concepts
Grants and funding
LinkOut - more resources
Full Text Sources
Other Literature Sources
Medical
Molecular Biology Databases

