

Integrative analysis of liver-specific non-coding regulatory SNPs associated with the risk of coronary artery disease
- PMID: 33626337
- PMCID: PMC8008493
- DOI: 10.1016/j.ajhg.2021.02.006
Integrative analysis of liver-specific non-coding regulatory SNPs associated with the risk of coronary artery disease
Abstract
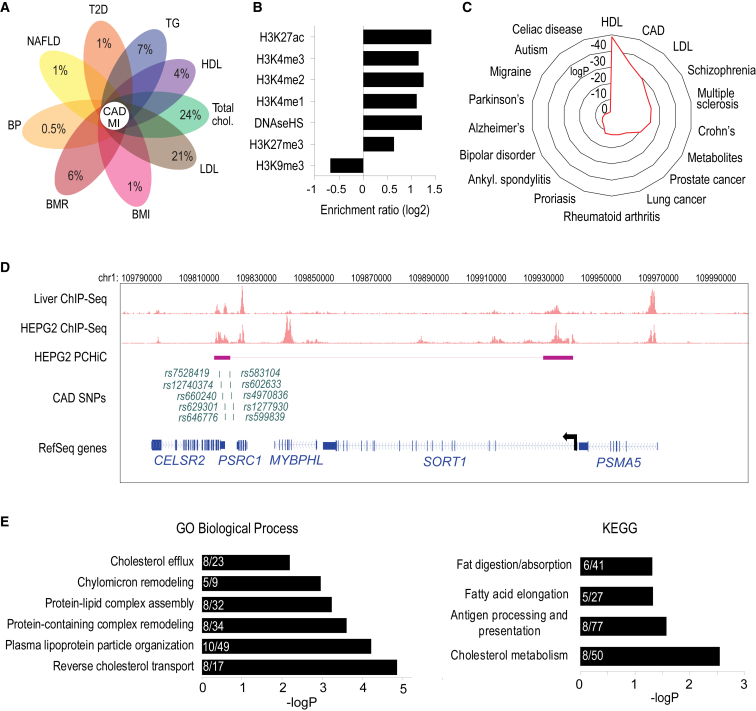
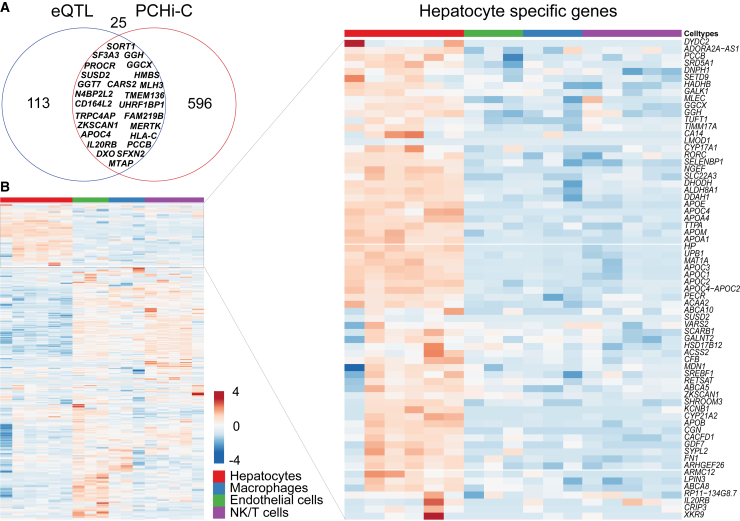
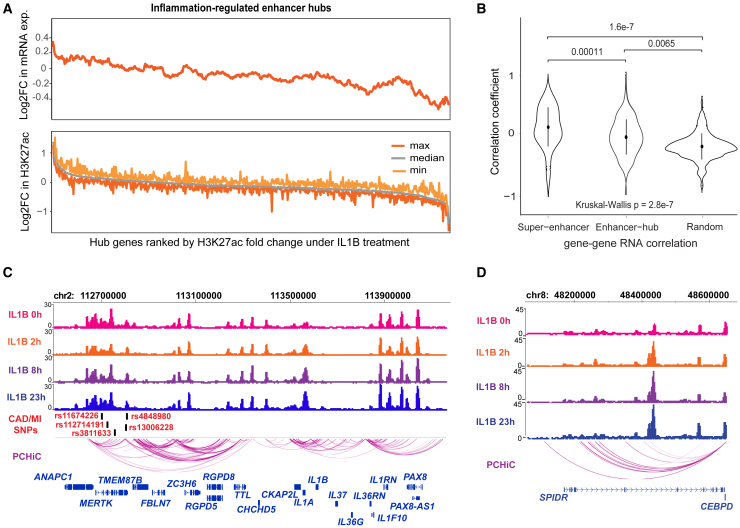
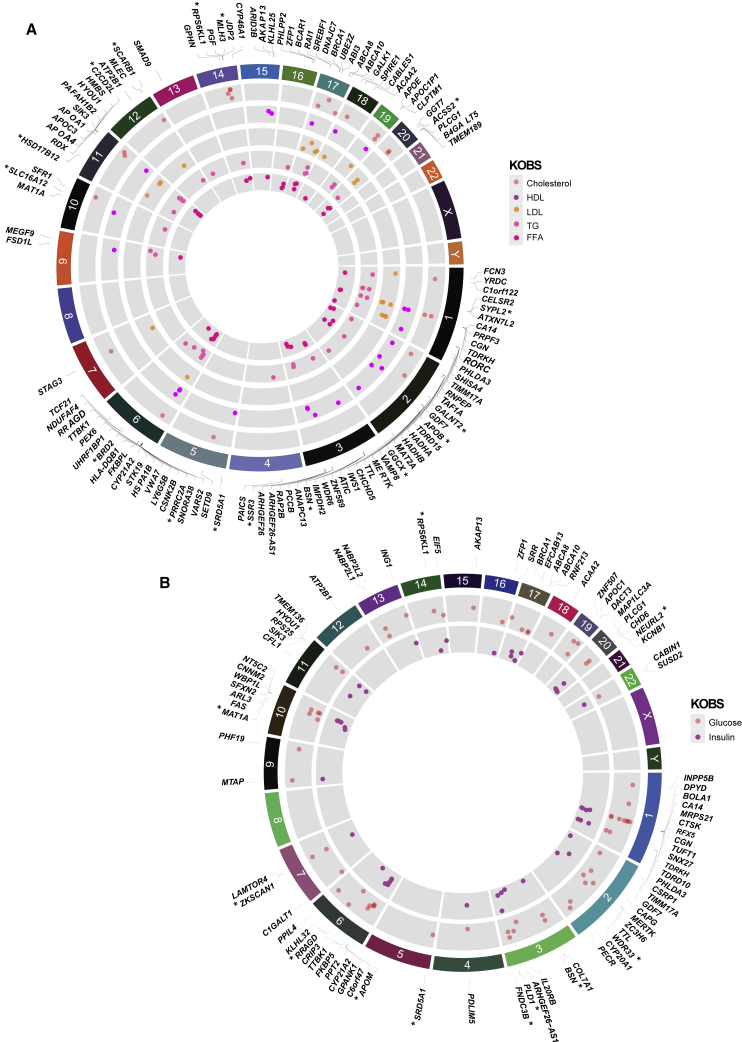
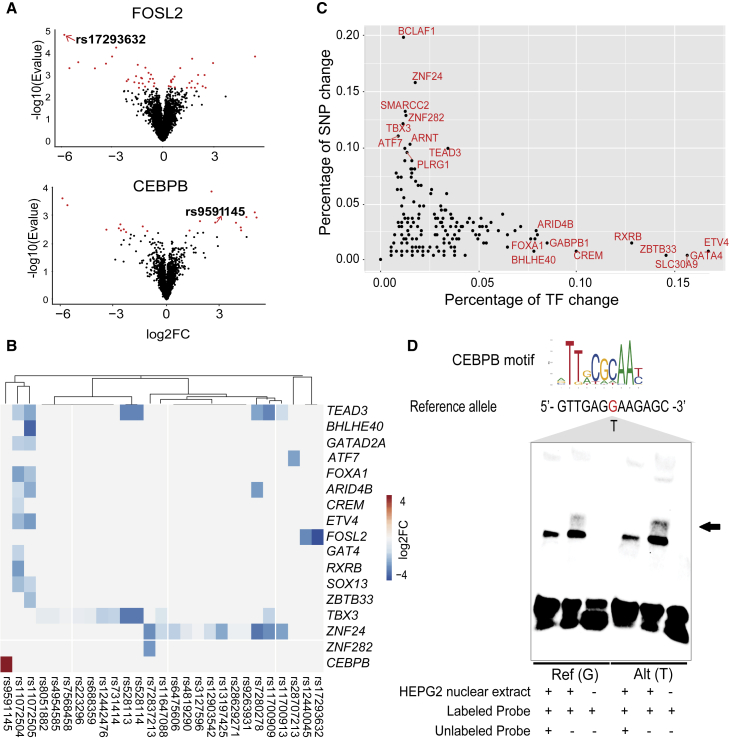
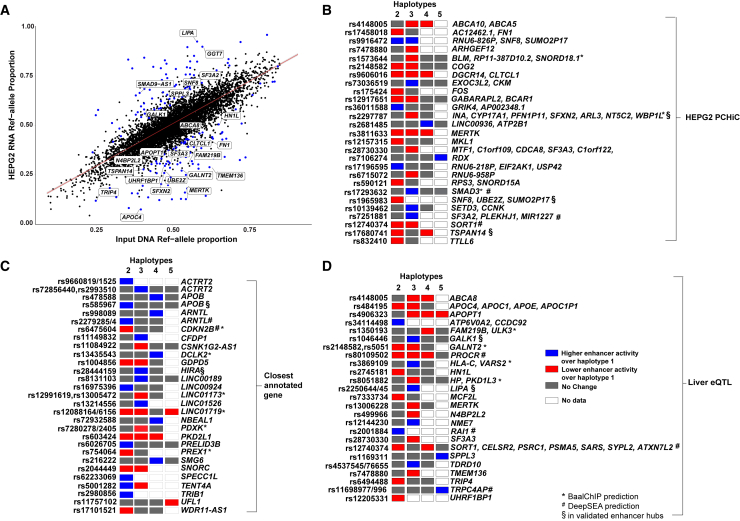
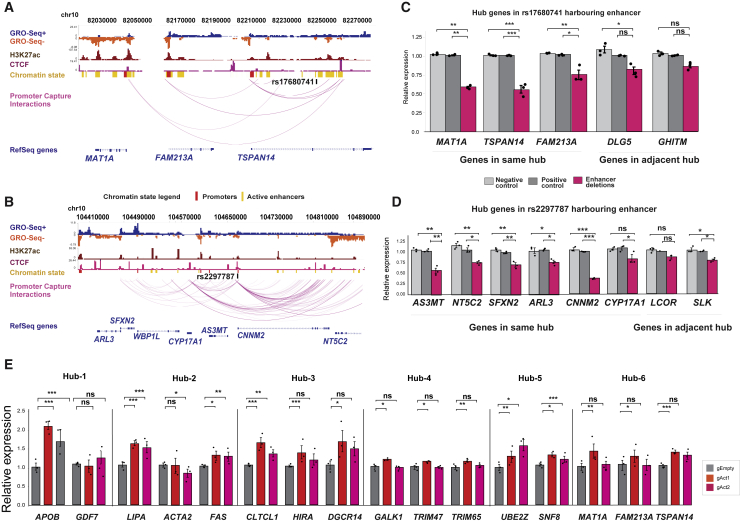
Genetic factors underlying coronary artery disease (CAD) have been widely studied using genome-wide association studies (GWASs). However, the functional understanding of the CAD loci has been limited by the fact that a majority of GWAS variants are located within non-coding regions with no functional role. High cholesterol and dysregulation of the liver metabolism such as non-alcoholic fatty liver disease confer an increased risk of CAD. Here, we studied the function of non-coding single-nucleotide polymorphisms in CAD GWAS loci located within liver-specific enhancer elements by identifying their potential target genes using liver cis-eQTL analysis and promoter Capture Hi-C in HepG2 cells. Altogether, 734 target genes were identified of which 121 exhibited correlations to liver-related traits. To identify potentially causal regulatory SNPs, the allele-specific enhancer activity was analyzed by (1) sequence-based computational predictions, (2) quantification of allele-specific transcription factor binding, and (3) STARR-seq massively parallel reporter assay. Altogether, our analysis identified 1,277 unique SNPs that display allele-specific regulatory activity. Among these, susceptibility enhancers near important cholesterol homeostasis genes (APOB, APOC1, APOE, and LIPA) were identified, suggesting that altered gene regulatory activity could represent another way by which genetic variation regulates serum lipoprotein levels. Using CRISPR-based perturbation, we demonstrate how the deletion/activation of a single enhancer leads to changes in the expression of many target genes located in a shared chromatin interaction domain. Our integrative genomics approach represents a comprehensive effort in identifying putative causal regulatory regions and target genes that could predispose to clinical manifestation of CAD by affecting liver function.
Keywords: CRISPR; GWAS; SNP; STARR-seq; cholesterol; coronary artery disease; enhancer; functional genomics; hepatocyte; liver.
Copyright © 2021 American Society of Human Genetics. Published by Elsevier Inc. All rights reserved.
Conflict of interest statement
The authors declare no competing interests.
Figures
Similar articles
-
Multiple Functional Variants at 13q14 Risk Locus for Osteoporosis Regulate RANKL Expression Through Long-Range Super-Enhancer.J Bone Miner Res. 2018 Jul;33(7):1335-1346. doi: 10.1002/jbmr.3419. Epub 2018 May 17. J Bone Miner Res. 2018. PMID: 29528523
-
Integrative functional analysis of super enhancer SNPs for coronary artery disease.J Hum Genet. 2018 May;63(5):627-638. doi: 10.1038/s10038-018-0422-2. Epub 2018 Feb 28. J Hum Genet. 2018. PMID: 29491472
-
On the identification of potential regulatory variants within genome wide association candidate SNP sets.BMC Med Genomics. 2014 Jun 11;7:34. doi: 10.1186/1755-8794-7-34. BMC Med Genomics. 2014. PMID: 24920305 Free PMC article.
-
Functional genomics and assays of regulatory activity detect mechanisms at loci for lipid traits and coronary artery disease.Curr Opin Genet Dev. 2018 Jun;50:52-59. doi: 10.1016/j.gde.2018.02.004. Epub 2018 Feb 20. Curr Opin Genet Dev. 2018. PMID: 29471259 Free PMC article. Review.
-
Using omics data and genome editing methods to decipher GWAS loci associated with coronary artery disease.Atherosclerosis. 2025 Feb;401:118621. doi: 10.1016/j.atherosclerosis.2024.118621. Epub 2025 Feb 3. Atherosclerosis. 2025. PMID: 39909615 Review.
Cited by
-
Integrating Multimorbidity into a Whole-Body Understanding of Disease Using Spatial Genomics.Results Probl Cell Differ. 2022;70:157-187. doi: 10.1007/978-3-031-06573-6_5. Results Probl Cell Differ. 2022. PMID: 36348107
-
Omics-based construction of regulatory variants can be applied to help decipher pig liver-related traits.Commun Biol. 2024 Mar 29;7(1):381. doi: 10.1038/s42003-024-06050-7. Commun Biol. 2024. PMID: 38553586 Free PMC article.
-
Technological advancements in functional interpretation of genome-wide association studies (GWAS) findings: bridging the gap to clinical translation.FEBS Lett. 2024 Dec;598(23):2852-2853. doi: 10.1002/1873-3468.14884. Epub 2024 Apr 29. FEBS Lett. 2024. PMID: 38683017 Free PMC article. Review.
-
Cross-tissue omics analysis discovers ten adipose genes encoding secreted proteins in obesity-related non-alcoholic fatty liver disease.EBioMedicine. 2023 Jun;92:104620. doi: 10.1016/j.ebiom.2023.104620. Epub 2023 May 22. EBioMedicine. 2023. PMID: 37224770 Free PMC article.
-
scGWAS: landscape of trait-cell type associations by integrating single-cell transcriptomics-wide and genome-wide association studies.Genome Biol. 2022 Oct 17;23(1):220. doi: 10.1186/s13059-022-02785-w. Genome Biol. 2022. PMID: 36253801 Free PMC article.
References
Publication types
MeSH terms
Substances
Grants and funding
LinkOut - more resources
Full Text Sources
Other Literature Sources
Medical
Molecular Biology Databases
Research Materials
Miscellaneous
