. 2021 Feb 23;34(8):108769.
doi: 10.1016/j.celrep.2021.108769.

Chromatin dysregulation associated with NSD1 mutation in head and neck squamous cell carcinoma

Affiliations

Chromatin dysregulation associated with NSD1 mutation in head and neck squamous cell carcinoma

Nargess Farhangdoost et al. Cell Rep. .

Abstract

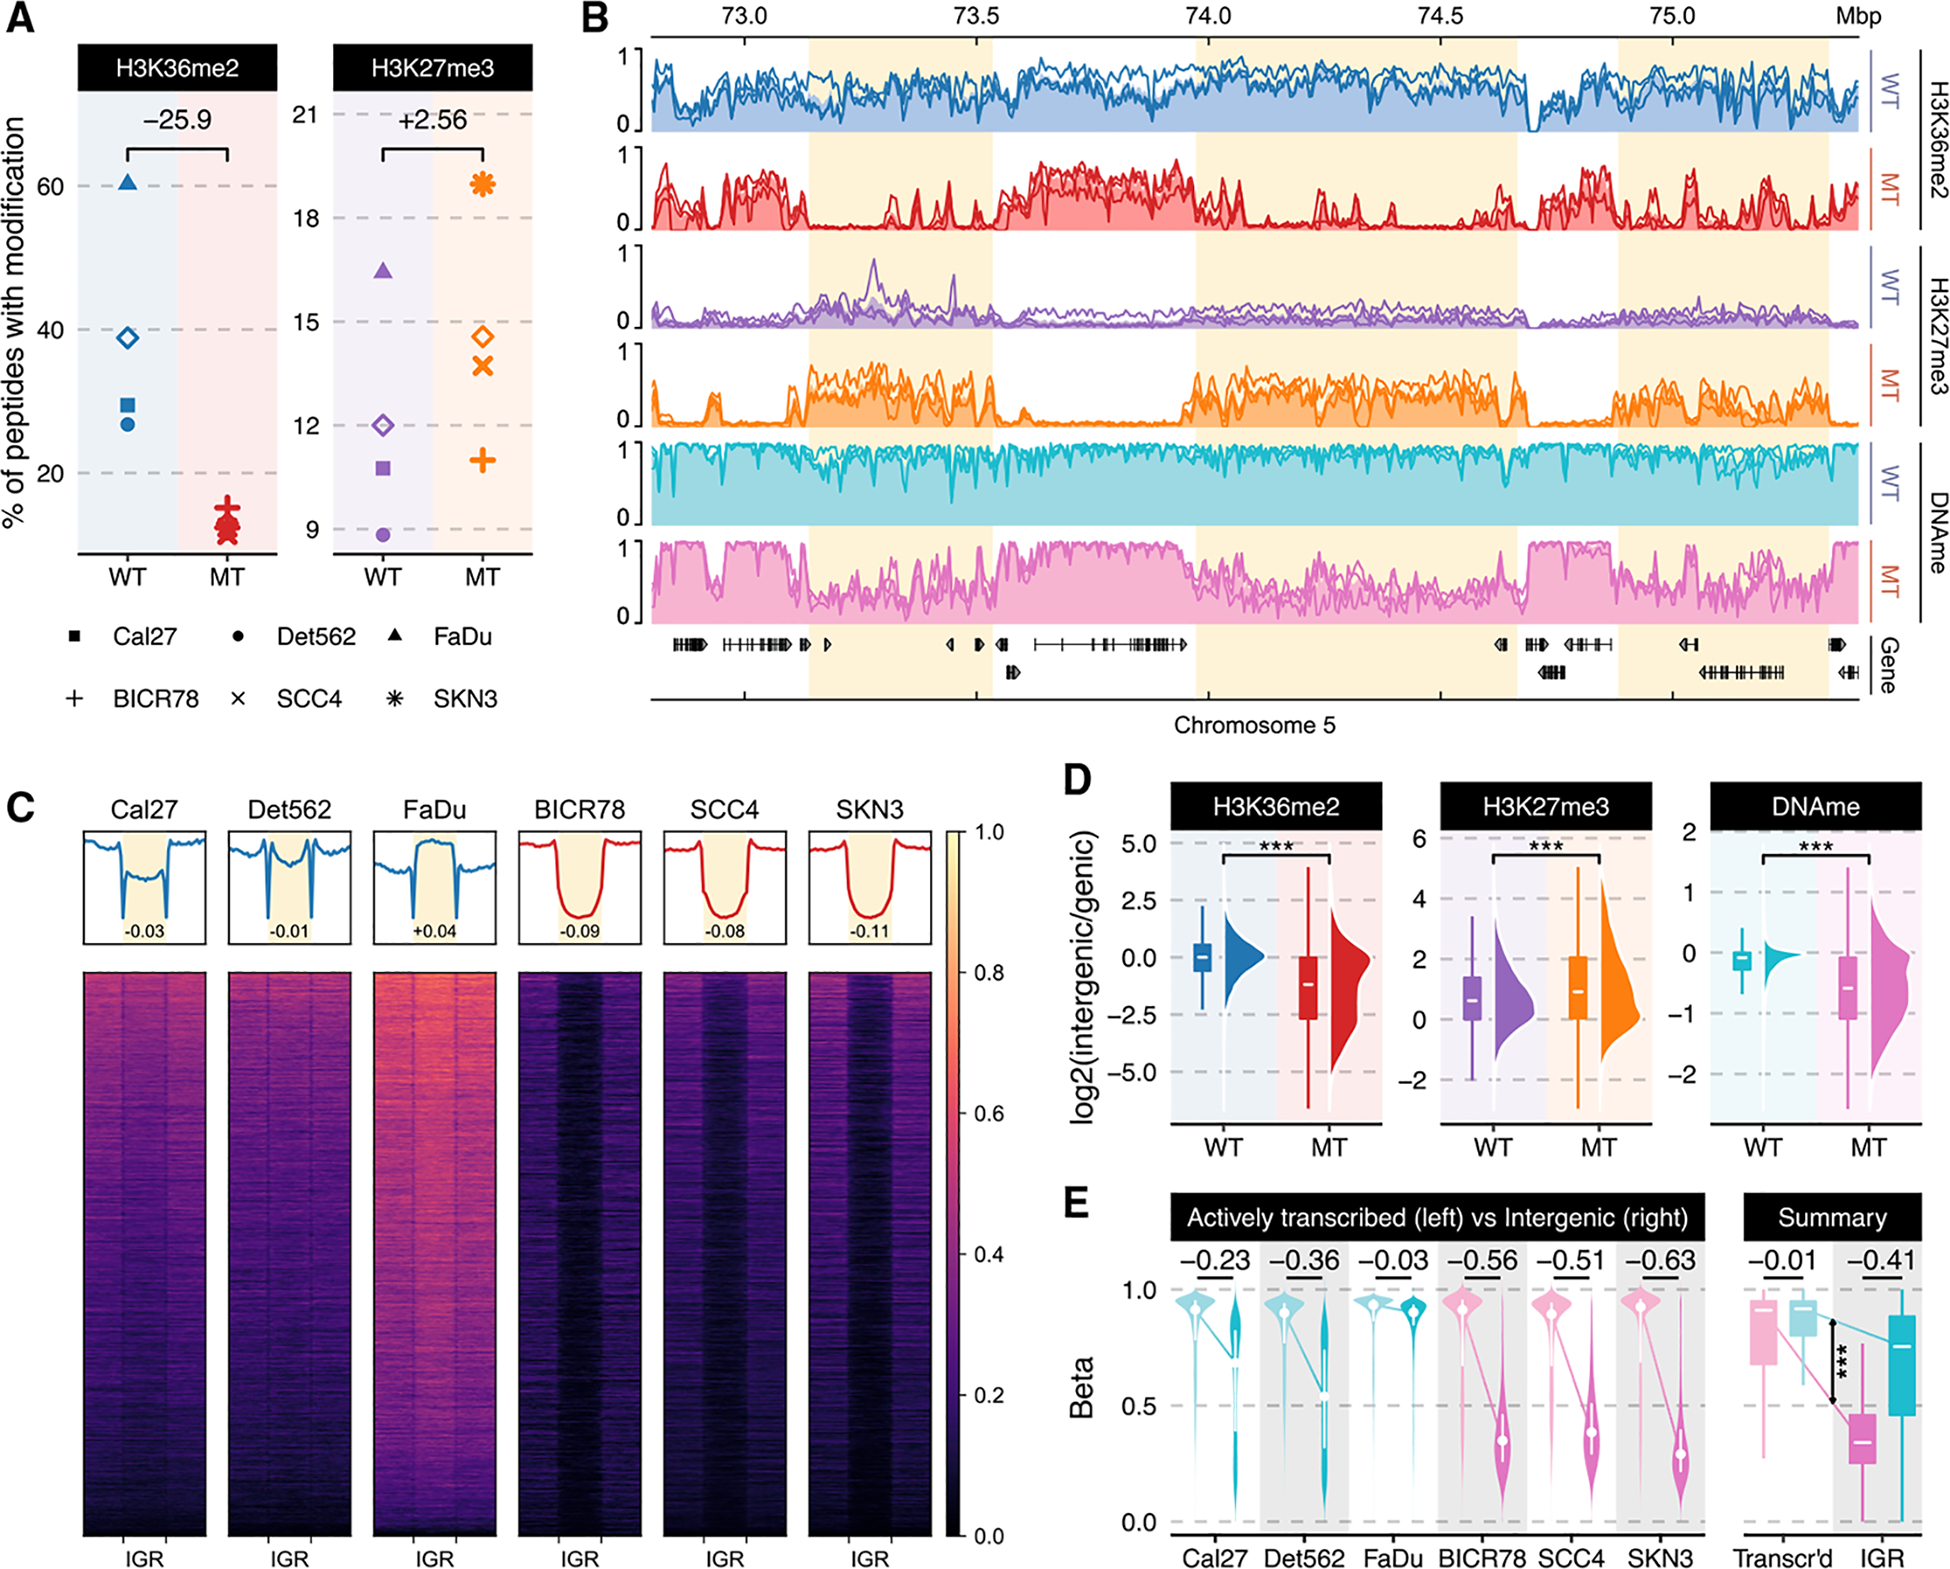
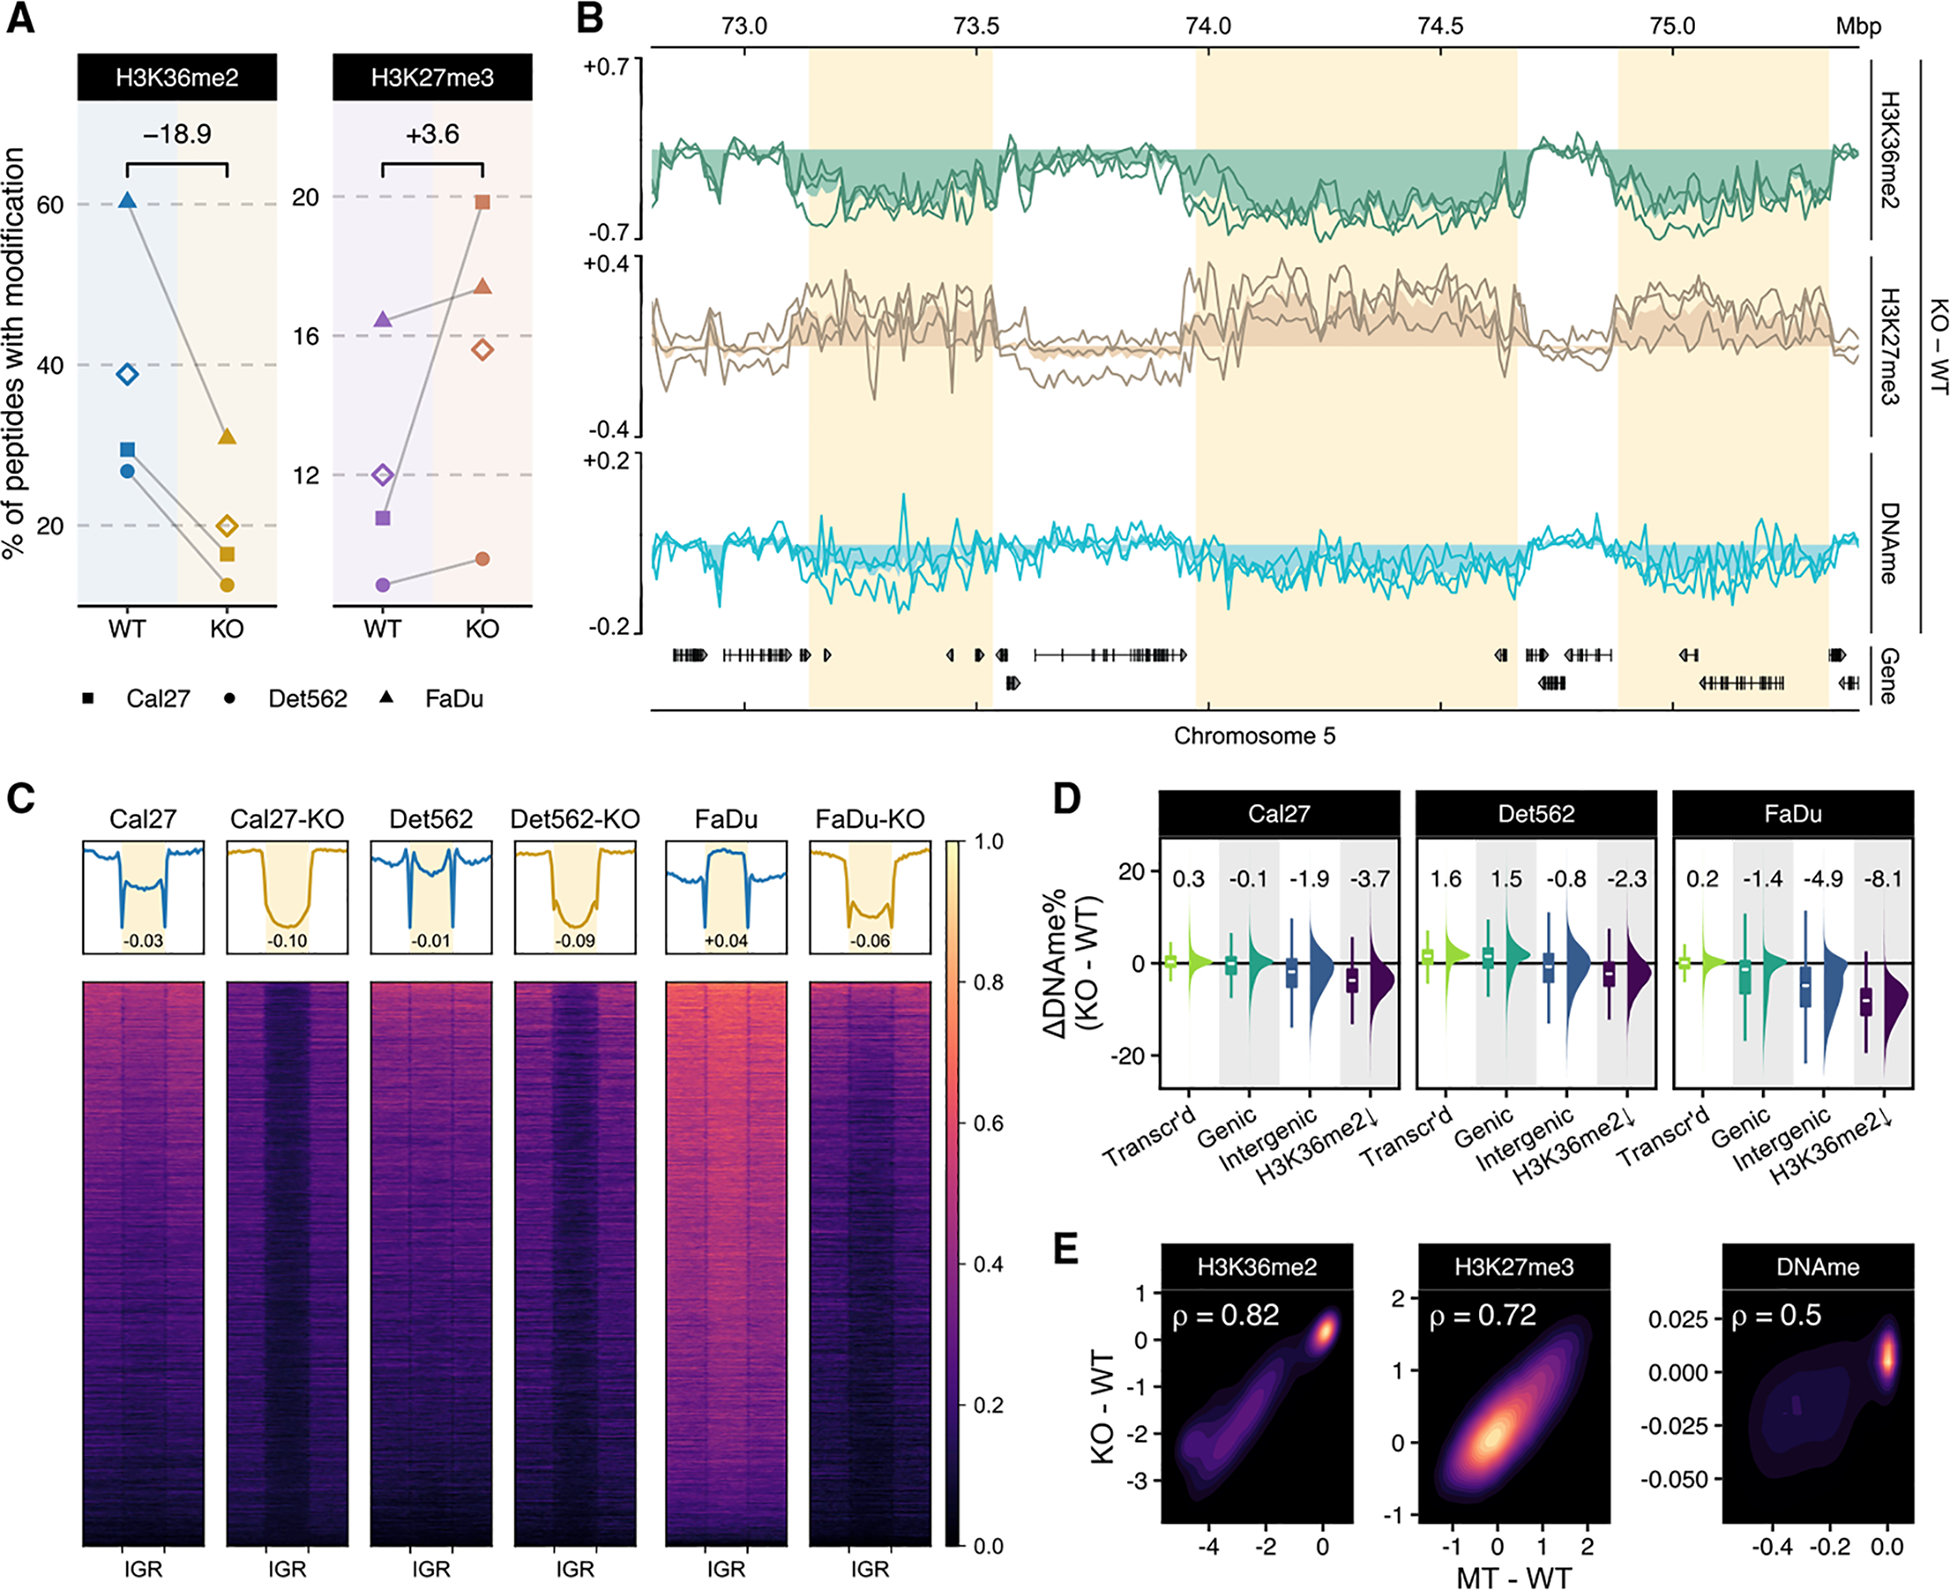
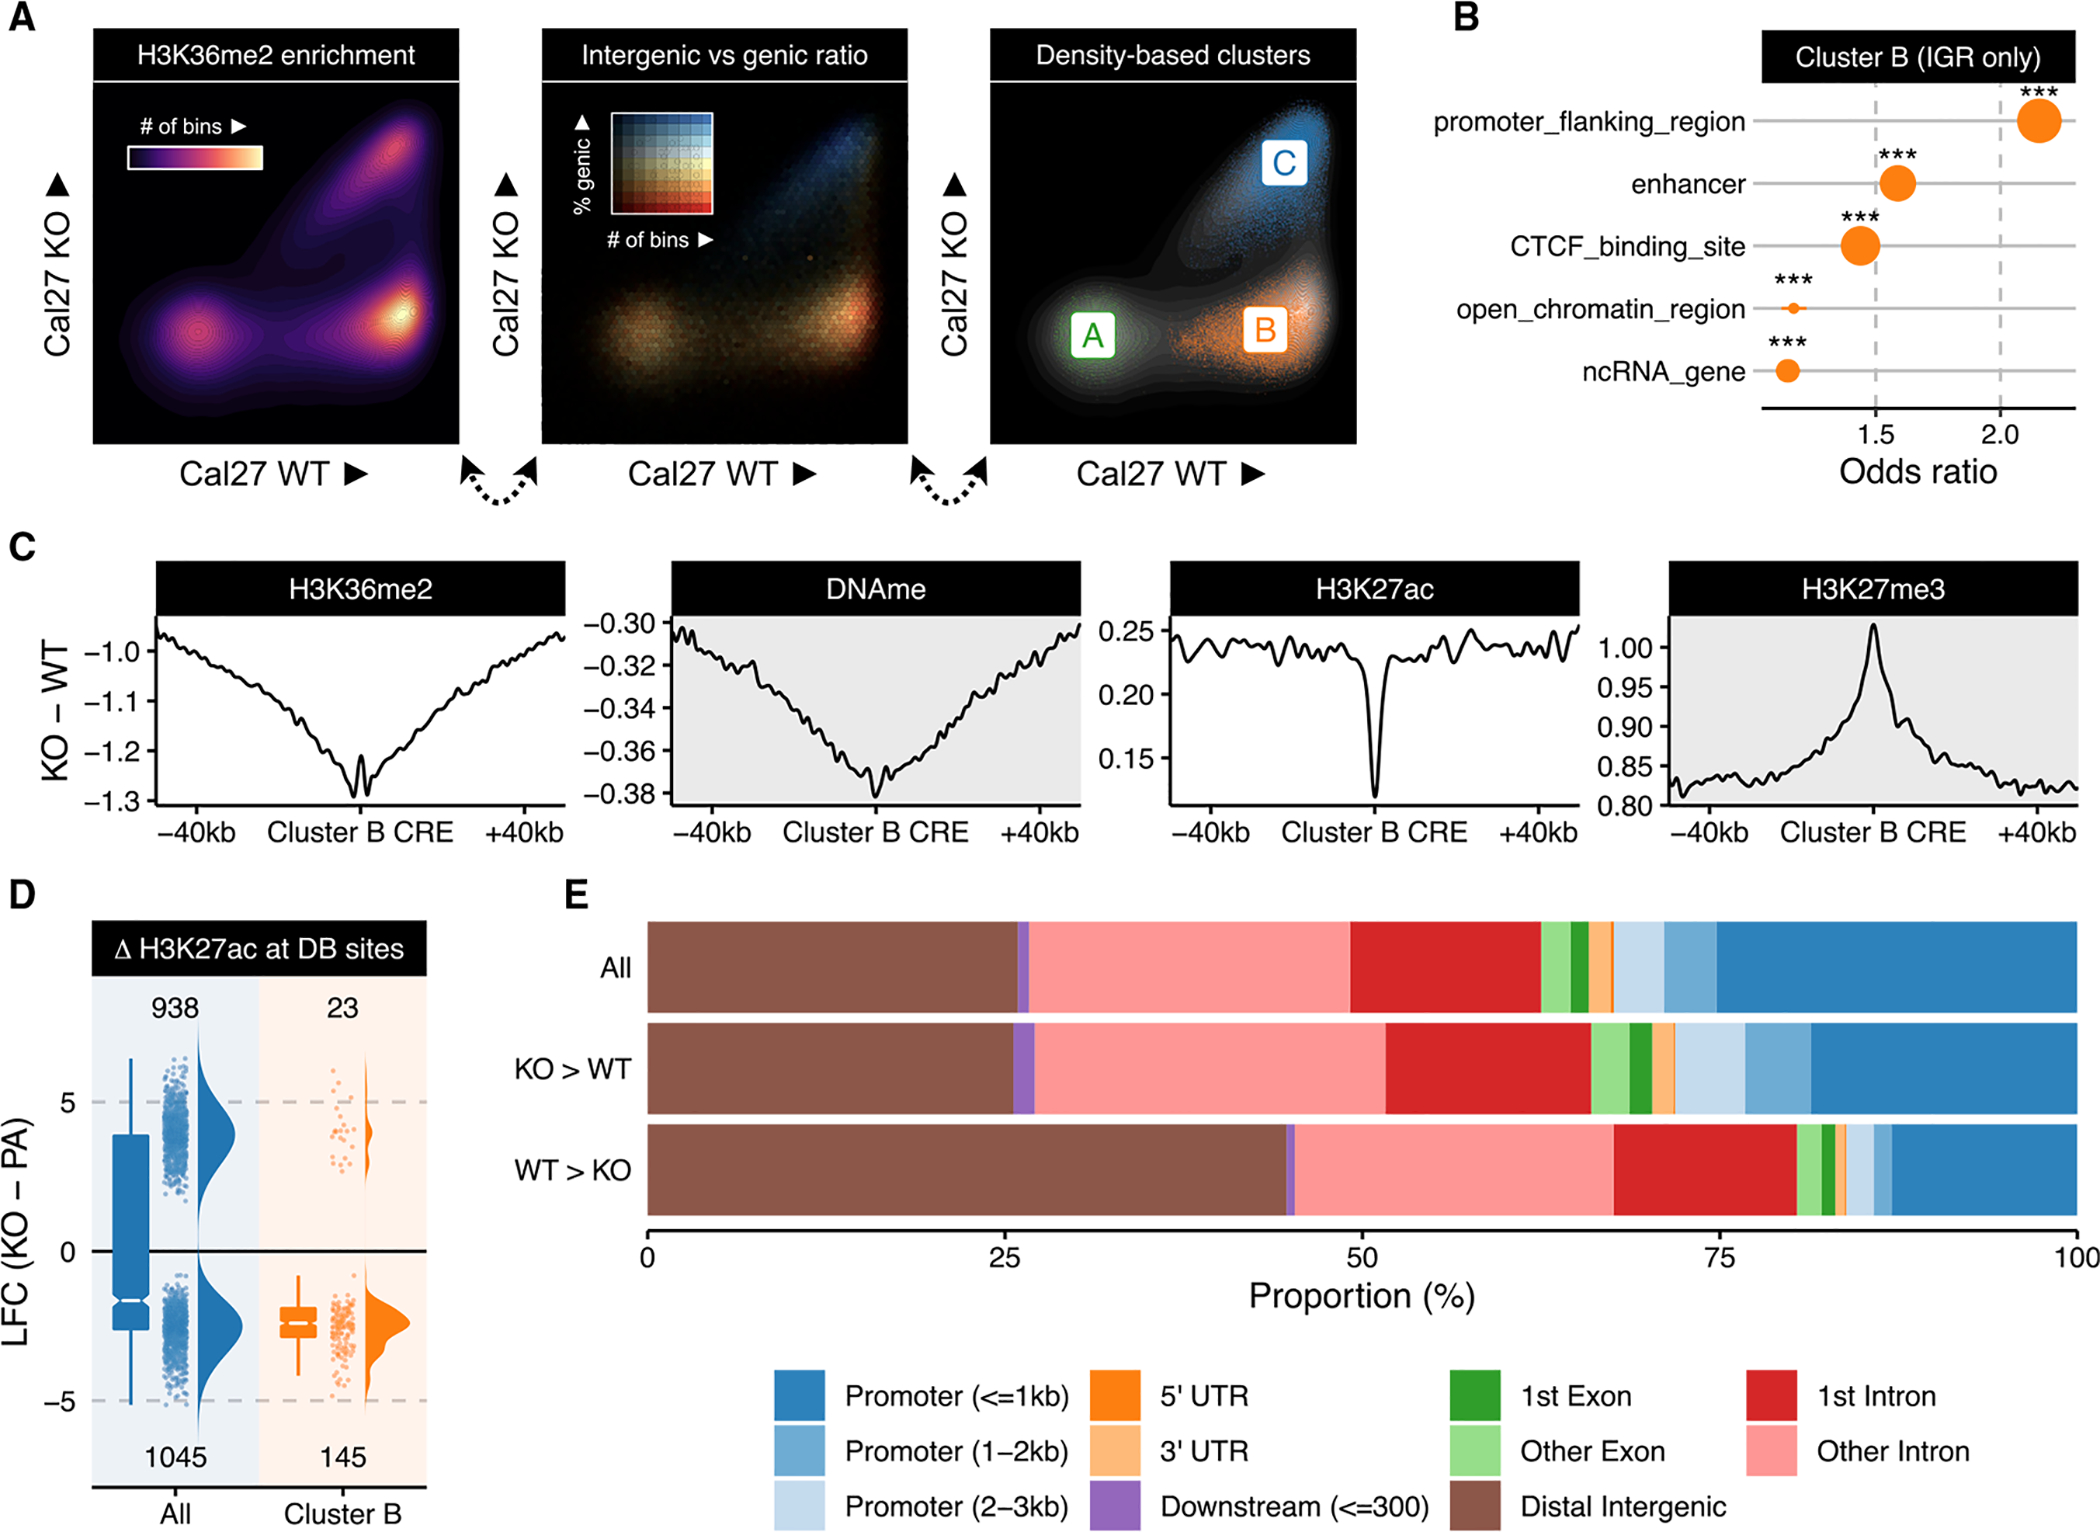
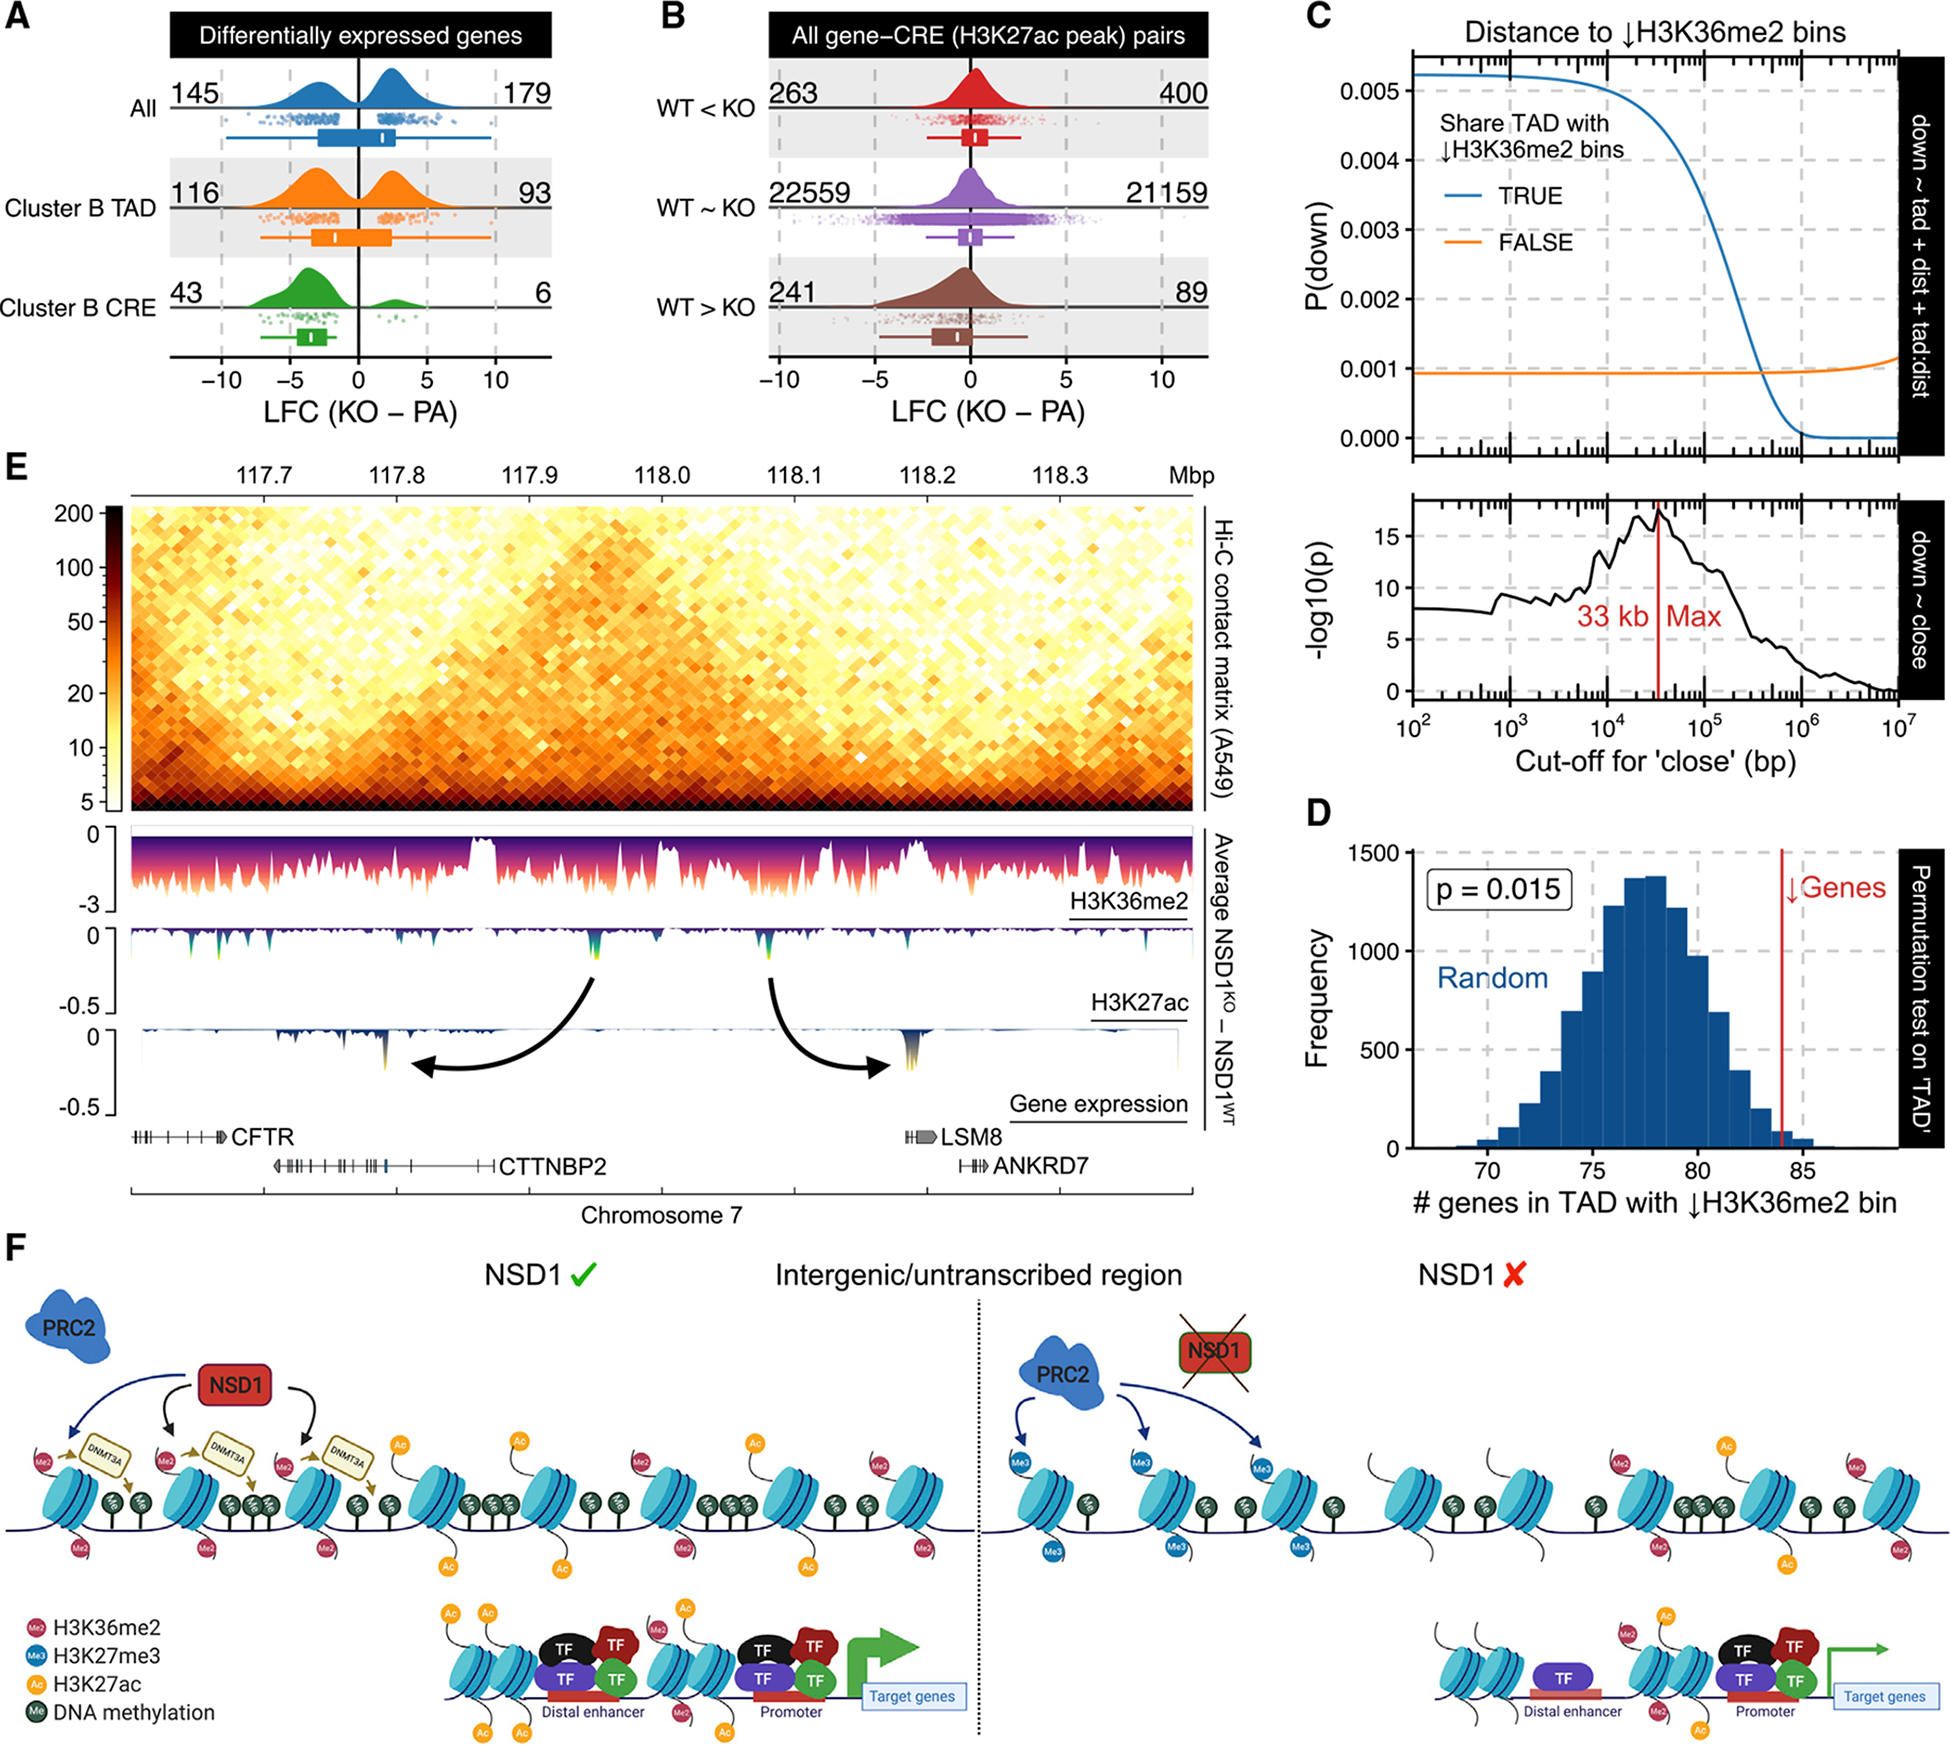
Chromatin dysregulation has emerged as an important mechanism of oncogenesis. To develop targeted treatments, it is important to understand the transcriptomic consequences of mutations in chromatin modifier genes. Recently, mutations in the histone methyltransferase gene nuclear receptor binding SET domain protein 1 (NSD1) have been identified in a subset of common and deadly head and neck squamous cell carcinomas (HNSCCs). Here, we use genome-wide approaches and genome editing to dissect the downstream effects of loss of NSD1 in HNSCC. We demonstrate that NSD1 mutations are responsible for loss of intergenic H3K36me2 domains, followed by loss of DNA methylation and gain of H3K27me3 in the affected genomic regions. In addition, those regions are enriched in cis-regulatory elements, and subsequent loss of H3K27ac correlates with reduced expression of their target genes. Our analysis identifies genes and pathways affected by the loss of NSD1 and paves the way to further understanding the interplay among chromatin modifications in cancer.

Keywords: cis-regulatory elements; epigenomics; head and neck squamous cell carcinoma; histone H3 lysine 36 dimethylation; histone modifications; nuclear receptor binding SET domain protein 1.


Conflict of interest statement

Declaration of interests The authors declare no competing interests.

Figures

Figure 1.
Figure 1.. Epigenomic characterization of NSD1-WT and MT HNSCC cell lines
(A) Genome-wide prevalence of modifications based on mass spectrometry; diamonds represent within-condition averages; p values obtained using Welch’s t test: H3K36me2 (p = 0.07) and H3K27me3 (p = 0.240). (B) Genome-browser tracks displaying individual samples as lines and condition averages as area plots in a lighter shade; ChIP-seq signals shown are mass spectrometry (MS)-normalized logCPM and beta values are used for WGBS; regions of noticeable difference are highlighted. (C) Heatmaps showing H3K36me2 (MS-normalized logCPM (log counts per million)) enrichment patterns ± 20 kb flanking intergenic regions (IGRs); n = 10,630. Numbers displayed at the bottom of aggregate plots correspond to the intergenic/genic ratio where transcription start sites (TSS)/transcription end sites (TES) and outer edges are excluded. (D) Relative enrichment of signal within intergenic regions over those of flanking genes; CPM values are used for ChIP-seq and beta values for WGBS; ***Wilcoxon rank sum test p < 1e-5. In the box plots, the lower and upper hinge correspond to the first and third quartile; the upper whiskers extend to the largest value ≤ 1.5 * interquartile range (IQR) and vice versa for the lower whiskers. (E) Distribution of DNA methylation beta values within actively transcribed genes (zFPKM > −3; Hart et al., 2013) compared against those in intergenic regions. *** represents p value < 1e-5 based on the difference-in-difference estimator of differential methylation between genic and intergenic regions. In the violin plots, the white dots correspond to the median and the lines span the IQR. In the box plots, the lower and upper hinge correspond to the first and third quartile; the upper whiskers extend to the largest value ≤ 1.5 * IQR and vice versa for the lower whiskers.
Figure 2.
Figure 2.. Epigenomic characterization of NSD1-WT and KO HNSCC cell lines
(A) Genome-wide prevalence of modifications based on mass spectrometry; diamonds represent within-condition averages; p values obtained using Welch’s t test: H3K36me2 p = 0.04; H3K27me3 p = 0.16. In this plot and all the following ones, Cal27-KO corresponds to replicate 1, Det562-KO to replicate 2, and FaDu-KO to replicate 1, unless otherwise specified. (B) Genome-browser tracks displaying individual cell-line differences (KO-PA) as lines and condition averages as area plots in a lighter shade; ChIP-seq signals shown are MS-normalized logCPM and beta values are used for WGBS; regions of noticeable difference in Figure 1B are highlighted. (C) Heatmaps showing H3K36me2 enrichment patterns centered on IGRs; n = 10,630. Numbers displayed at the bottom of aggregate plots correspond to the intergenic/genic ratio where TSS/TES and outer edges are excluded. (D) Distribution of differential beta values within actively transcribed genes, all genes, intergenic regions, and regions depleted of H3K36me2 (corresponding to regions defined in Figure 3A as “cluster B”); median values are shown at the top. For the boxplots, the lower and upper hinge correspond to the first and third quartile; the upper whiskers extend to the largest value ≤ 1.5 * IQR and vice versa for the lower whiskers. (E) Spearman correlation of differential enrichment between NSD1-WT versus KO and WT versus MT.
Figure 3.
Figure 3.. Loss of NSD1 preferentially impacts distal intergenic cis-regulatory elements
(A) Scatterplots of H3K36me2 enrichment (10-kb resolution) comparing a representative WT parental sample (Cal27) against its NSD1-KO counterpart (replicate 1; see also Figure S3A for other cell lines). (B) Overlap enrichment result of Ensembl annotations with bins consistently labeled as cluster B (i.e., identified as B in all three paired WT versus KO comparisons). Stratification is applied to only focus on intergenic regions to avoid spurious associations to annotations confounded by their predominantly intergenic localization. The size of the dots corresponds to number of bins overlapping the corresponding annotation. *** represents p-value < 1e-5 based on Fisher’s exact test of bins overlapping a specific class of annotated regions versus a background of all non-quiescent bins, meaning >10 reads in at least one mark in one sample. (C) Aggregate plots of differential signal enrichment centered around CREs overlapping (n = 5,193) consistent cluster B bins. Values are averaged across all three WT versus KO comparisons. (D) Log fold change of H3K27ac normalized enrichment values comparing all differentially bound sites to those overlapping consistent cluster B bins. For the box plots, the lower and upper hinge correspond to the first and third quartile; the upper whiskers extend to the largest value ≤ 1.5 * IQR and vice versa for the lower whiskers. (E) Distribution of genomic compartments overlapping various subsets of H3K27ac peaks categorized by differential binding status.
Figure 4.
Figure 4.. Loss of H3K36me2 domains and enhancer H3K27ac affects expression of target genes
(A) Log fold-change (LFC) of various subsets of DEGs. The lower and upper hinge in the box plots correspond to the first and third quartile; the upper whiskers extend to the largest value ≤ 1.5 * IQR and vice versa for the lower whiskers. (B) LFC of putative target genes for various differential binding (DB) site subsets. For the box plots, the lower and upper hinge correspond to the first and third quartile; the upper whiskers extend to the largest value ≤ 1.5 * IQR and vice versa for the lower whiskers. (C) Logistic regression model outputs for expression downregulation status based on its distance to and/or whether it shares a TAD with a cluster B bin. (D) Permutation test on downregulated genes’ tendency to share a TAD with cluster B bin, controlling for distance. (E) Example loci illustrating genome-wide phenomenon using differential signal tracks in which enrichment values of the respective parental line were subtracted from the corresponding KOs, after which the average across lines was taken. (F) Schematic model of epigenetic dysregulation resulting from the absence of NSD1 (created with https://biorender.com). Note that, in the absence of NSD1, PRC2 deposits H3K27me3 in the same intergenic regions where H3K36me2 was depleted. In addition, H3K27ac decreases around distal enhancers located in these H3K36me2-depleted regions.
Figure 5.
Figure 5.. Changes in transcriptome and pathways resulted from loss of NSD1 and reduced H3K36me2 levels
(A) GSEA enrichment plot of hallmark gene sets significantly associated with the aggregated ranking of differentially expressed genes and genes targeted by differentially acetylated enhancers using their test statistics. (B) Motifs exhibiting differential activity between up- versus downregulated peaks, with dots representing the strength of association in each direction and triangles their difference. (C) Aggregated motif density plots around differential H3K27ac sites for the most significant differentially associated motifs in each direction. (D) Stratified rank-rank hypergeometric overlap plot of gene expression differences between NSD1-WT versus MT and WT versus KO. (E) Distribution of expression changes for leading edge genes of hallmark gene sets significantly associated with the aggregated ranking of differential gene expression for both NSD1-WT versus MT and WT versus KO. The error bars indicate the interquartile range (IQR).
Figure 6.
Figure 6.. Validation of cell-line-based observations in primary tumors from TCGA
(A) TCGA-HNSC samples were ranked by relative similarity to NSD1-WT and KO cell line samples (top), NSD1 mutational status was tabulated (middle), and enrichment of NSD1 mutational groups within quantiles was computed (bottom). (B) Differential CpG methylation across all sites is contrasted against those located in regions depleted of H3K36me2 upon NSD1-KO (i.e., cluster B bins). For the box plots, the lower and upper hinge correspond to the first and third quartile; the upper whiskers extend to the largest value ≤ 1.5 * IQR and vice versa for the lower whiskers. (C) Rank-rank hypergeometric overlap of genes ranked by LFC in cell line system and TCGA; see Figure 5D. (D) Most significant results from GSEA on genes ranked by concordant upregulation (or downregulation) of gene expression and enhancer accessibility and DNA methylation, with the values associated with constituent genes shown to the right. The error bars indicate the interquartile range (IQR).

Similar articles

Cited by

References

    1. Abugessaisa I, Noguchi S, Hasegawa A, Kondo A, Kawaji H, Carninci P, and Kasukawa T (2019). refTSS: a reference data set for human and mouse transcription start sites. J. Mol. Biol 431, 2407–2422. - PubMed
    1. Amemiya HM, Kundaje A, and Boyle AP (2019). The ENCODE blacklist: identification of problematic regions of the genome. Sci. Rep 9, 9354. - PMC - PubMed
    1. Ang KK, Harris J, Wheeler R, Weber R, Rosenthal DI, Nguyen-Tân PF, Westra WH, Chung CH, Jordan RC, Lu C, et al. (2010). Human papillomavirus and survival of patients with oropharyngeal cancer. N. Engl. J. Med 363, 24–35. - PMC - PubMed
    1. Barutcu AR, Lajoie BR, McCord RP, Tye CE, Hong D, Messier TL, Browne G, van Wijnen AJ, Lian JB, Stein JL, et al. (2015). Chromatin interaction analysis reveals changes in small chromosome and telomere clustering between epithelial and breast cancer cells. Genome Biol 16, 214. - PMC - PubMed
    1. Baxi S, Fury M, Ganly I, Rao S, and Pfister DG (2012). Ten years of progress in head and neck cancers. J. Natl. Compr. Canc. Netw 10, 806–810. - PMC - PubMed

Publication types

MeSH terms