High-fat feeding disrupts daily eating behavior rhythms in obesity-prone but not in obesity-resistant male inbred mouse strains
- PMID: 33626995
- PMCID: PMC8163612
- DOI: 10.1152/ajpregu.00150.2020
High-fat feeding disrupts daily eating behavior rhythms in obesity-prone but not in obesity-resistant male inbred mouse strains
Abstract
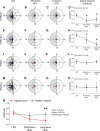
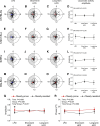
Abnormal meal timing, like skipping breakfast and late-night snacking, is associated with obesity in humans. Disruption of daily eating rhythms also contributes to obesity in mice. When fed a high-fat diet, male C57BL/6J mice have disrupted eating behavior rhythms and they become obese. In contrast to obesity-prone C57BL/6J mice, some inbred strains of mice are resistant to high-fat diet-induced obesity. In this study, we sought to determine whether there are distinct effects of high-fat feeding on daily eating behavior rhythms in obesity-prone and obesity-resistant male mice. Male obesity-prone (C57BL/6J and 129X1/SvJ) and obesity-resistant (SWR/J and BALB/cJ) mice were fed low-fat diet or high-fat diet for 6 wk. Consistent with previous studies, obesity-prone male mice gained more weight and adiposity during high-fat diet feeding than obesity-resistant male mice. The amplitude of the daily rhythm of eating behavior was markedly attenuated in male obesity-prone mice fed high-fat diet, but not in obesity-resistant males. In contrast, high-fat feeding did not differentially affect locomotor activity rhythms in obesity-prone and obesity-resistant male mice. Together, these data suggest that regulation of the daily rhythm of eating may underlie the propensity to develop diet-induced obesity in male mice.
Keywords: circadian; eating behavior rhythm; high-fat diet; mouse; obesity.
Figures


Similar articles
-
Timing of food intake is more potent than habitual voluntary exercise to prevent diet-induced obesity in mice.Chronobiol Int. 2019 Jan;36(1):57-74. doi: 10.1080/07420528.2018.1516672. Epub 2018 Sep 13. Chronobiol Int. 2019. PMID: 30212233
-
Differential effects of high-fat diet on glucose tolerance, food intake, and glucocorticoid regulation in male C57BL/6J and BALB/cJ mice.Physiol Behav. 2020 Mar 1;215:112773. doi: 10.1016/j.physbeh.2019.112773. Epub 2019 Dec 16. Physiol Behav. 2020. PMID: 31837387
-
Estradiol regulates daily rhythms underlying diet-induced obesity in female mice.Am J Physiol Endocrinol Metab. 2019 Dec 1;317(6):E1172-E1181. doi: 10.1152/ajpendo.00365.2019. Epub 2019 Nov 5. Am J Physiol Endocrinol Metab. 2019. PMID: 31689145 Free PMC article.
-
Response of peripheral rhythms to the timing of food intake.Methods Enzymol. 2015;552:145-61. doi: 10.1016/bs.mie.2014.10.027. Epub 2014 Dec 27. Methods Enzymol. 2015. PMID: 25707276 Review.
-
Circadian Rhythms in Diet-Induced Obesity.Adv Exp Med Biol. 2017;960:19-52. doi: 10.1007/978-3-319-48382-5_2. Adv Exp Med Biol. 2017. PMID: 28585194 Review.
Cited by
-
Chronic circadian disruption on a high-fat diet impairs glucose tolerance.Metabolism. 2022 May;130:155158. doi: 10.1016/j.metabol.2022.155158. Epub 2022 Feb 9. Metabolism. 2022. PMID: 35150732 Free PMC article.
-
Eating Around the Clock: Circadian Rhythms of Eating and Metabolism.Annu Rev Nutr. 2024 Aug;44(1):25-50. doi: 10.1146/annurev-nutr-062122-014528. Epub 2024 Aug 12. Annu Rev Nutr. 2024. PMID: 38848598 Free PMC article. Review.
-
The role of obesity and bariatric surgery-induced weight loss in breast cancer.Cancer Metastasis Rev. 2022 Sep;41(3):673-695. doi: 10.1007/s10555-022-10050-6. Epub 2022 Jul 23. Cancer Metastasis Rev. 2022. PMID: 35870055 Free PMC article. Review.
-
Mice with humanized livers reveal the role of hepatocyte clocks in rhythmic behavior.Sci Adv. 2023 May 19;9(20):eadf2982. doi: 10.1126/sciadv.adf2982. Epub 2023 May 17. Sci Adv. 2023. PMID: 37196091 Free PMC article.
-
Maternal high fat diet induces circadian clock-independent endocrine alterations impacting the metabolism of the offspring.iScience. 2024 Jun 21;27(7):110343. doi: 10.1016/j.isci.2024.110343. eCollection 2024 Jul 19. iScience. 2024. PMID: 39045103 Free PMC article.
References
-
- St-Onge MP, Ard J, Baskin ML, Chiuve SE, Johnson HM, Kris-Etherton P, Varady K; American Heart Association Obesity Committee of the Council on Lifestyle and Cardiometabolic Health, Council on Cardiovascular Disease in the Young, Council on Clinical Cardiology and Stroke Council. Meal timing and frequency: implications for cardiovascular disease prevention: a scientific statement from the American Heart Association. Circulation 135: e96–e121, 2017. doi:10.1161/CIR.0000000000000476. - DOI - PMC - PubMed
-
- Deshmukh-Taskar P, Nicklas TA, Radcliffe JD, O'Neil CE, Liu Y. The relationship of breakfast skipping and type of breakfast consumed with overweight/obesity, abdominal obesity, other cardiometabolic risk factors and the metabolic syndrome in young adults. The National Health and Nutrition Examination Survey (NHANES): 1999. Public Health Nutr 16: 2073–2082, 2013. doi:10.1017/S1368980012004296. - DOI - PMC - PubMed
Publication types
MeSH terms
Grants and funding
LinkOut - more resources
Full Text Sources
Other Literature Sources
Medical
Molecular Biology Databases

