

Penalized partial least squares for pleiotropy
- PMID: 33627076
- PMCID: PMC7905667
- DOI: 10.1186/s12859-021-03968-1
Penalized partial least squares for pleiotropy
Abstract
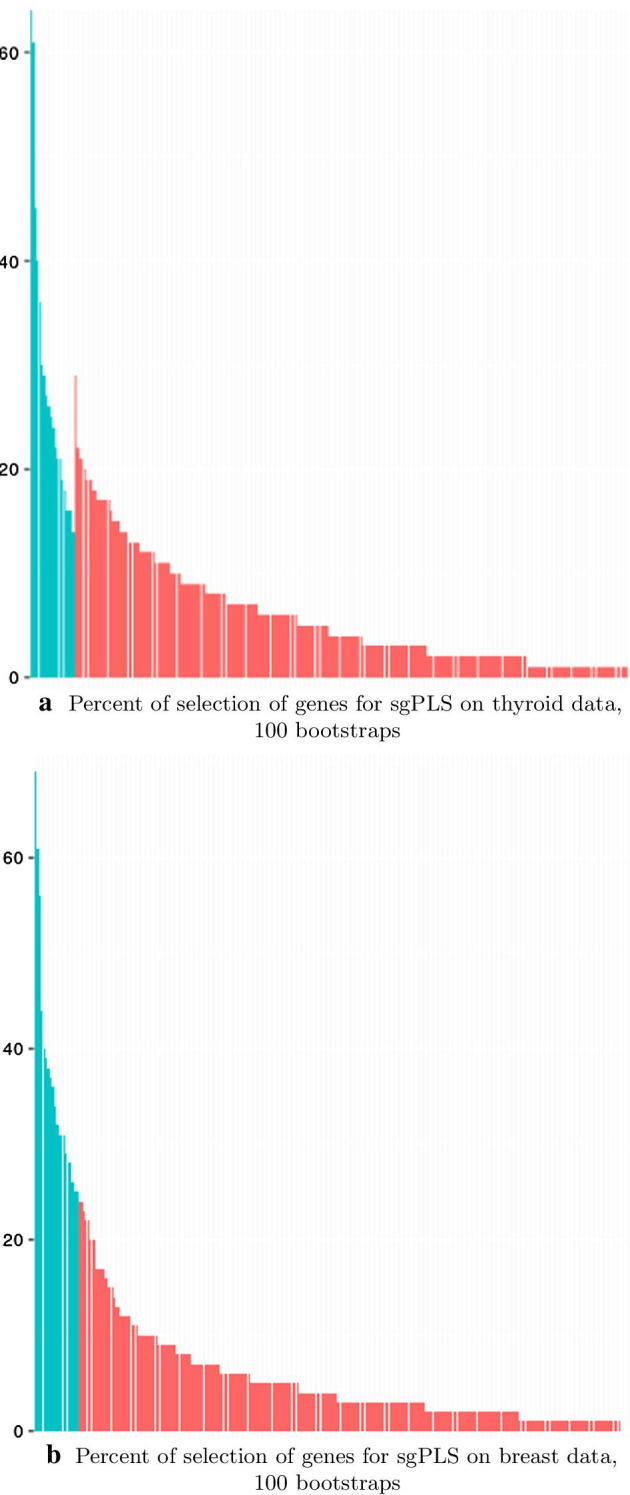
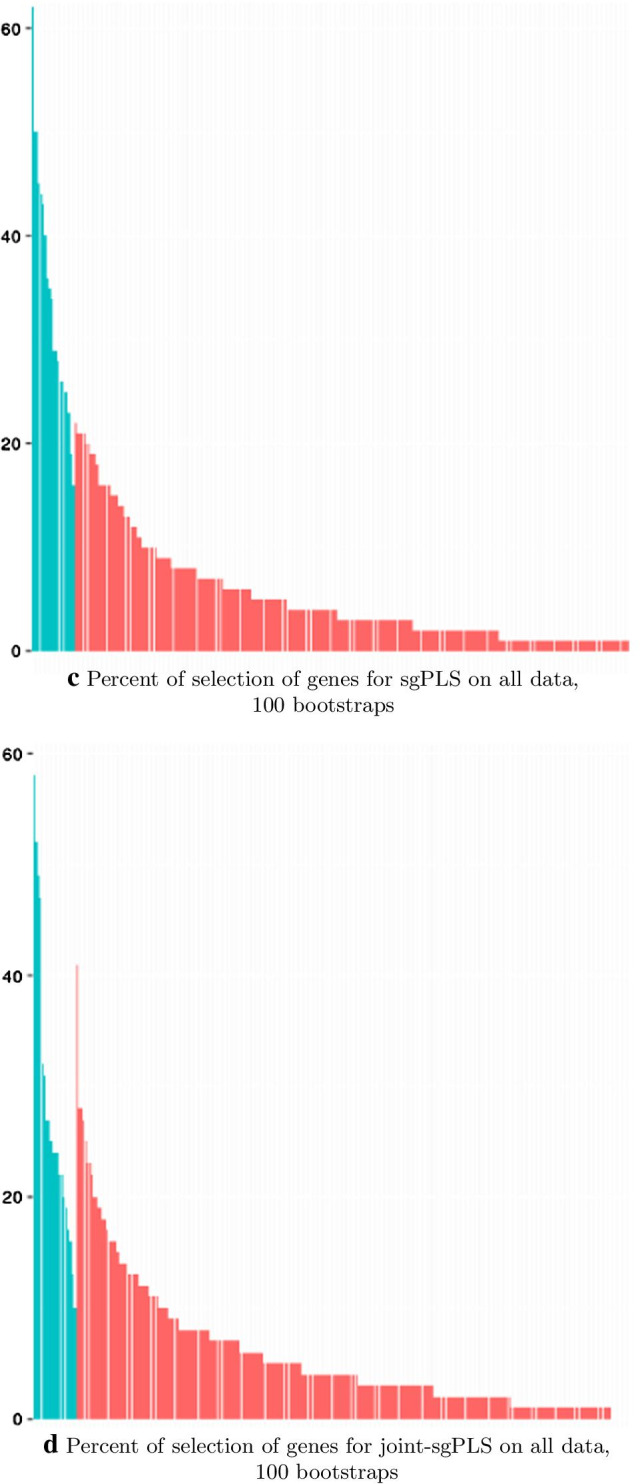
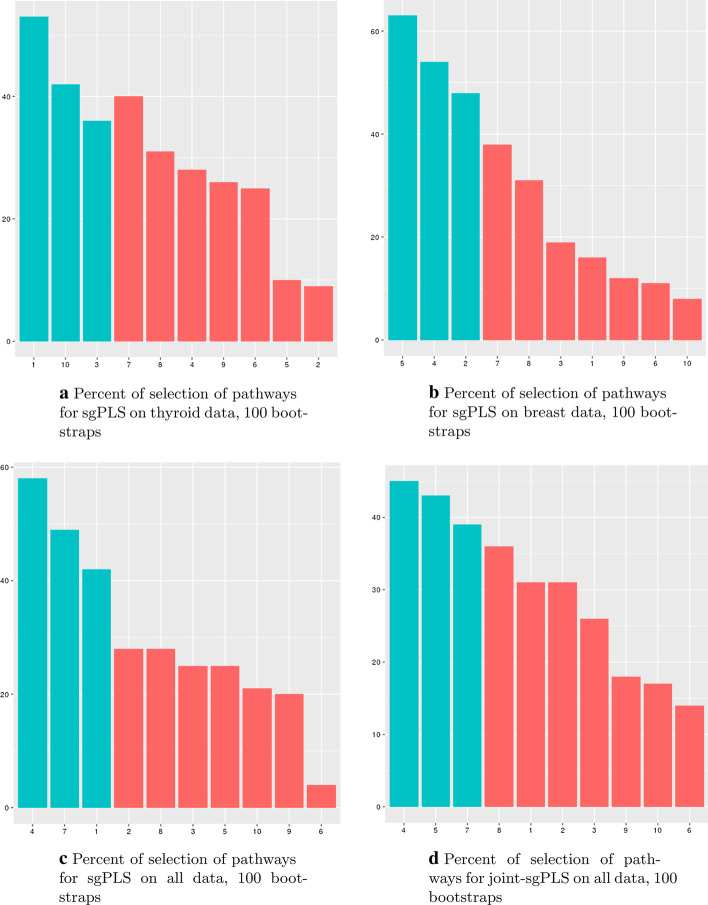
Background: The increasing number of genome-wide association studies (GWAS) has revealed several loci that are associated to multiple distinct phenotypes, suggesting the existence of pleiotropic effects. Highlighting these cross-phenotype genetic associations could help to identify and understand common biological mechanisms underlying some diseases. Common approaches test the association between genetic variants and multiple traits at the SNP level. In this paper, we propose a novel gene- and a pathway-level approach in the case where several independent GWAS on independent traits are available. The method is based on a generalization of the sparse group Partial Least Squares (sgPLS) to take into account groups of variables, and a Lasso penalization that links all independent data sets. This method, called joint-sgPLS, is able to convincingly detect signal at the variable level and at the group level.
Results: Our method has the advantage to propose a global readable model while coping with the architecture of data. It can outperform traditional methods and provides a wider insight in terms of a priori information. We compared the performance of the proposed method to other benchmark methods on simulated data and gave an example of application on real data with the aim to highlight common susceptibility variants to breast and thyroid cancers.
Conclusion: The joint-sgPLS shows interesting properties for detecting a signal. As an extension of the PLS, the method is suited for data with a large number of variables. The choice of Lasso penalization copes with architectures of groups of variables and observations sets. Furthermore, although the method has been applied to a genetic study, its formulation is adapted to any data with high number of variables and an exposed a priori architecture in other application fields.
Keywords: Genetic epidemiology; High dimensional data; Lasso Penalization; Meta-analysis; Oncology; Partial Least Square; Pathway analysis; Pleiotropy; Sparse methods; Variable selection.
Conflict of interest statement
The authors declare that they have no competing interests.
Figures
Similar articles
-
Leveraging pleiotropic association using sparse group variable selection in genomics data.BMC Med Res Methodol. 2022 Jan 7;22(1):9. doi: 10.1186/s12874-021-01491-8. BMC Med Res Methodol. 2022. PMID: 34996381 Free PMC article.
-
Pleiotropy informed adaptive association test of multiple traits using genome-wide association study summary data.Biometrics. 2019 Dec;75(4):1076-1085. doi: 10.1111/biom.13076. Epub 2019 Aug 2. Biometrics. 2019. PMID: 31021400 Free PMC article.
-
Bayesian meta-analysis models for cross cancer genomic investigation of pleiotropic effects using group structure.Stat Med. 2021 Mar 15;40(6):1498-1518. doi: 10.1002/sim.8855. Epub 2020 Dec 27. Stat Med. 2021. PMID: 33368447
-
A comprehensive gene-centric pleiotropic association analysis for 14 psychiatric disorders with GWAS summary statistics.BMC Med. 2021 Dec 13;19(1):314. doi: 10.1186/s12916-021-02186-z. BMC Med. 2021. PMID: 34895209 Free PMC article.
-
Recent innovations and in-depth aspects of post-genome wide association study (Post-GWAS) to understand the genetic basis of complex phenotypes.Heredity (Edinb). 2021 Dec;127(6):485-497. doi: 10.1038/s41437-021-00479-w. Epub 2021 Oct 23. Heredity (Edinb). 2021. PMID: 34689168 Free PMC article. Review.
References
MeSH terms
LinkOut - more resources
Full Text Sources
Other Literature Sources
Research Materials
