

Multilevel clustering approach driven by continuous glucose monitoring data for further classification of type 2 diabetes
- PMID: 33627315
- PMCID: PMC7908294
- DOI: 10.1136/bmjdrc-2020-001869
Multilevel clustering approach driven by continuous glucose monitoring data for further classification of type 2 diabetes
Abstract
Introduction: Mining knowledge from continuous glucose monitoring (CGM) data to classify highly heterogeneous patients with type 2 diabetes according to their characteristics remains unaddressed. A refined clustering method that retrieves hidden information from CGM data could provide a viable method to identify patients with different degrees of dysglycemia and clinical phenotypes.
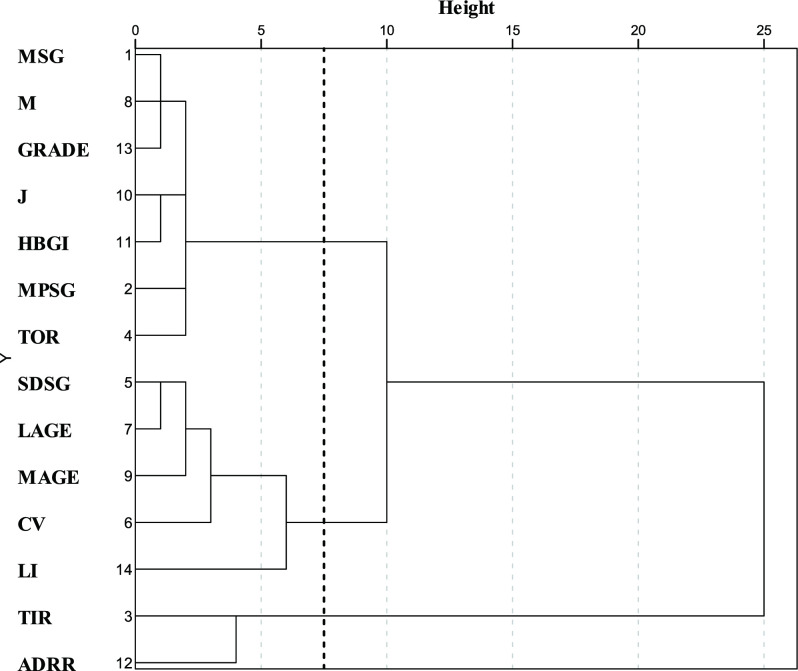
Research design and methods: From Shanghai Jiao Tong University Affiliated Sixth People's Hospital, we selected 908 patients with type 2 diabetes (18-83 years) who wore blinded CGM sensors (iPro2, Medtronic, California, USA). Participants were clustered based on CGM data during a 24-hour period by our method. The first level extracted the knowledge-based and statistics-based features to describe CGM signals from multiple perspectives. The Fisher score and variables cluster analysis were applied to fuse features into low dimensions at the second level. The third level divided subjects into subgroups with different clinical phenotypes. The four subgroups of patients were determined by clinical phenotypes.
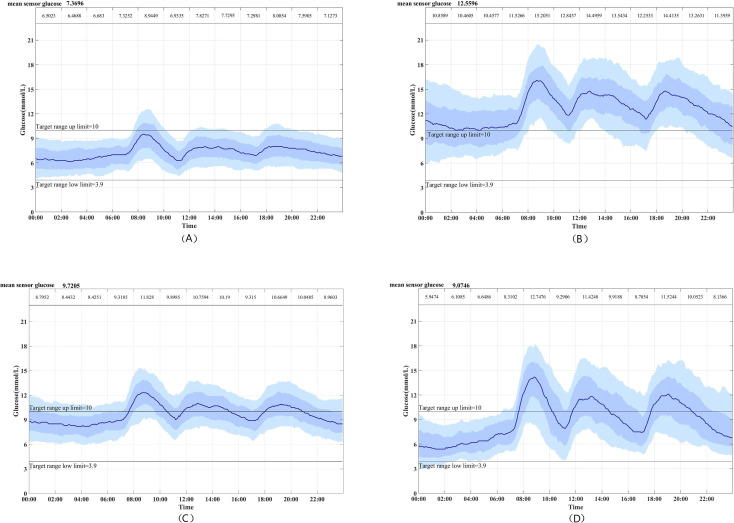
Results: Four subgroups of patients with type 2 diabetes with significantly different statistical features and clinical phenotypes were identified by our method. In particular, individuals in cluster 1 were characterized by the lowest glucose level factor and glucose fluctuation factor, and the highest negative glucose factor and C peptide index. By contrast, cluster 2 had the highest glucose level factor and the lowest C peptide index. Cluster 4 was characterized by the greatest degree of glucose fluctuation factor, was the most insulin-sensitive, and had the lowest insulin resistance. Cluster 3 ranked in the middle concerning the CGM-derived metrics and clinical phenotypes compared with those of the other three groups.
Conclusion: A novel multilevel clustering approach for knowledge mining from CGM data in type 2 diabetes is presented. The results demonstrate that subgroups are adequately distinguished with notable statistical and clinical differences.
Keywords: classification; diabetes mellitus; disease management; type 2 diabetes.
© Author(s) (or their employer(s)) 2021. Re-use permitted under CC BY-NC. No commercial re-use. See rights and permissions. Published by BMJ.
Conflict of interest statement
Competing interests: None declared.
Figures

References
Publication types
MeSH terms
Substances
LinkOut - more resources
Full Text Sources
Other Literature Sources
Medical