. 2021 Sep;70(9):2042-2057.
doi: 10.2337/db20-0572. Epub 2021 Feb 24.

Beneficial Metabolic Effects of TREM2 in Obesity Are Uncoupled From Its Expression on Macrophages

Affiliations

Beneficial Metabolic Effects of TREM2 in Obesity Are Uncoupled From Its Expression on Macrophages

Omar Sharif et al. Diabetes. 2021 Sep.

Abstract

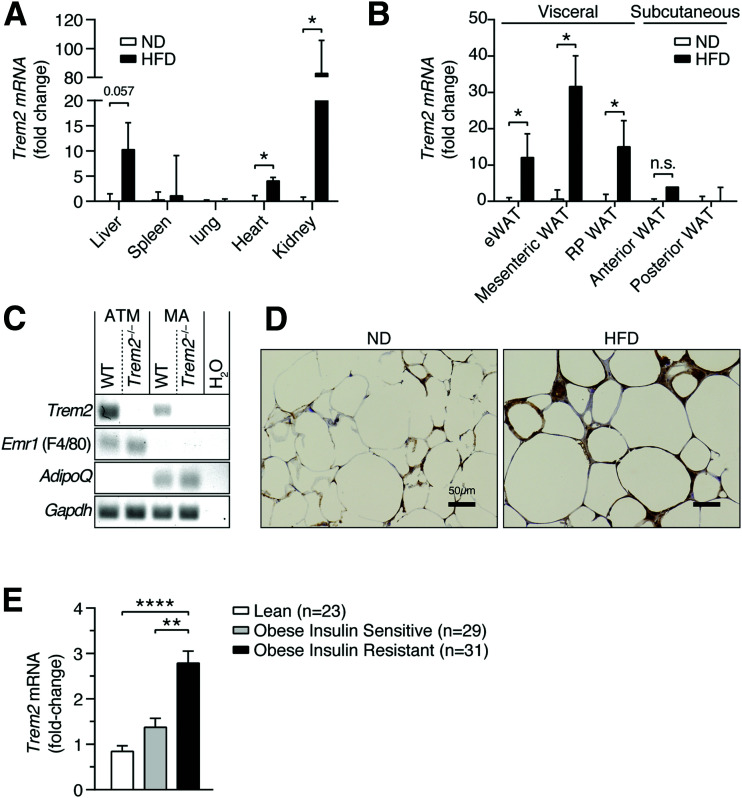
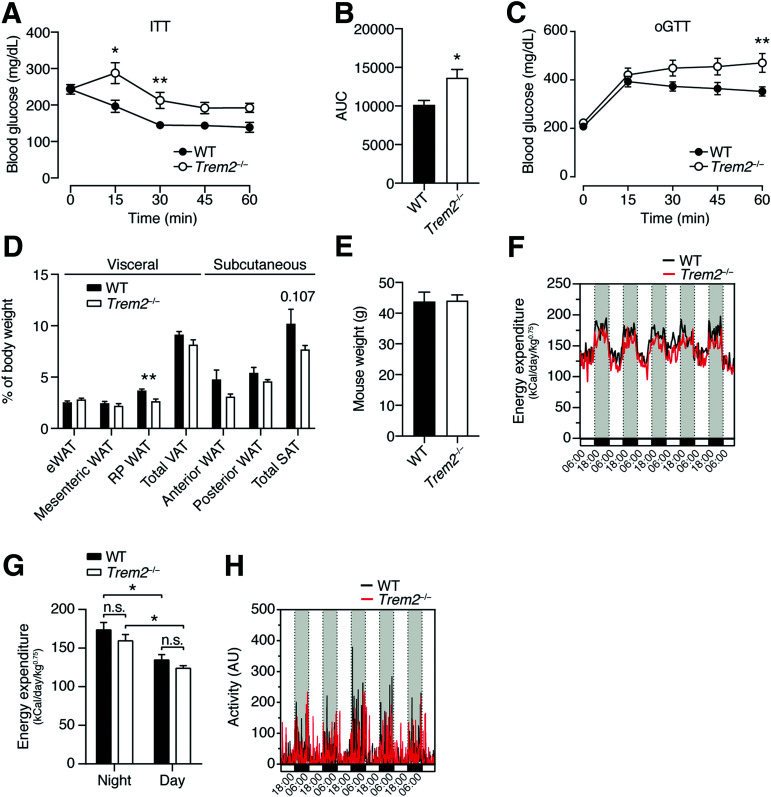
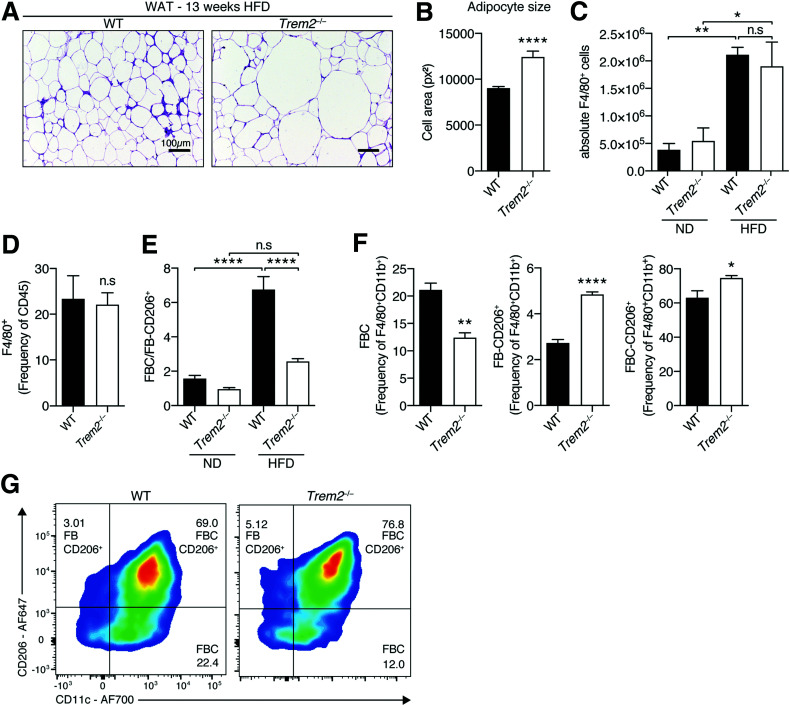
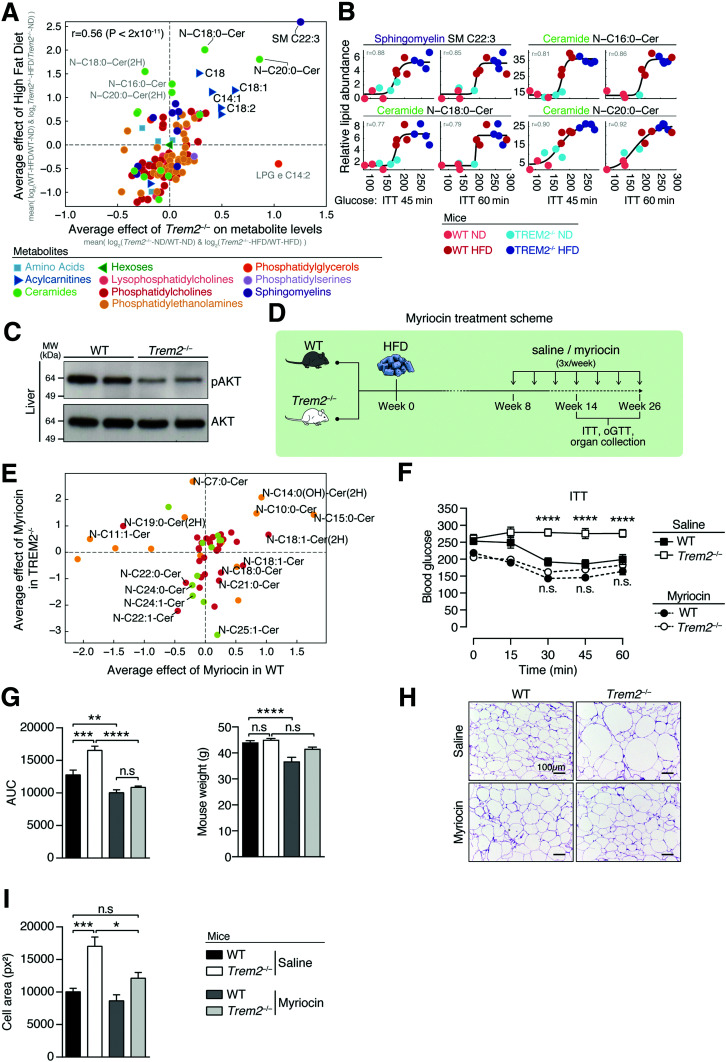
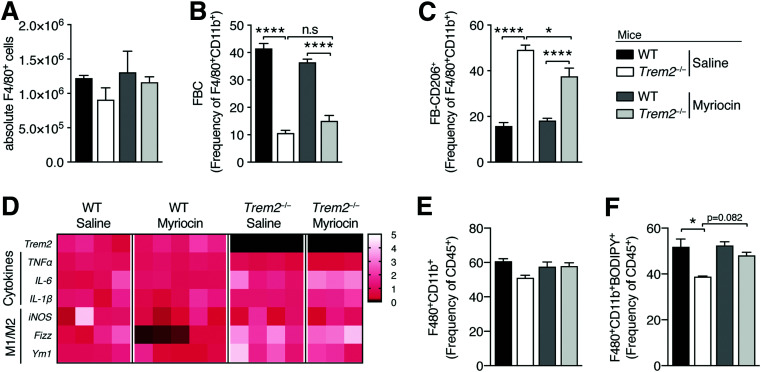
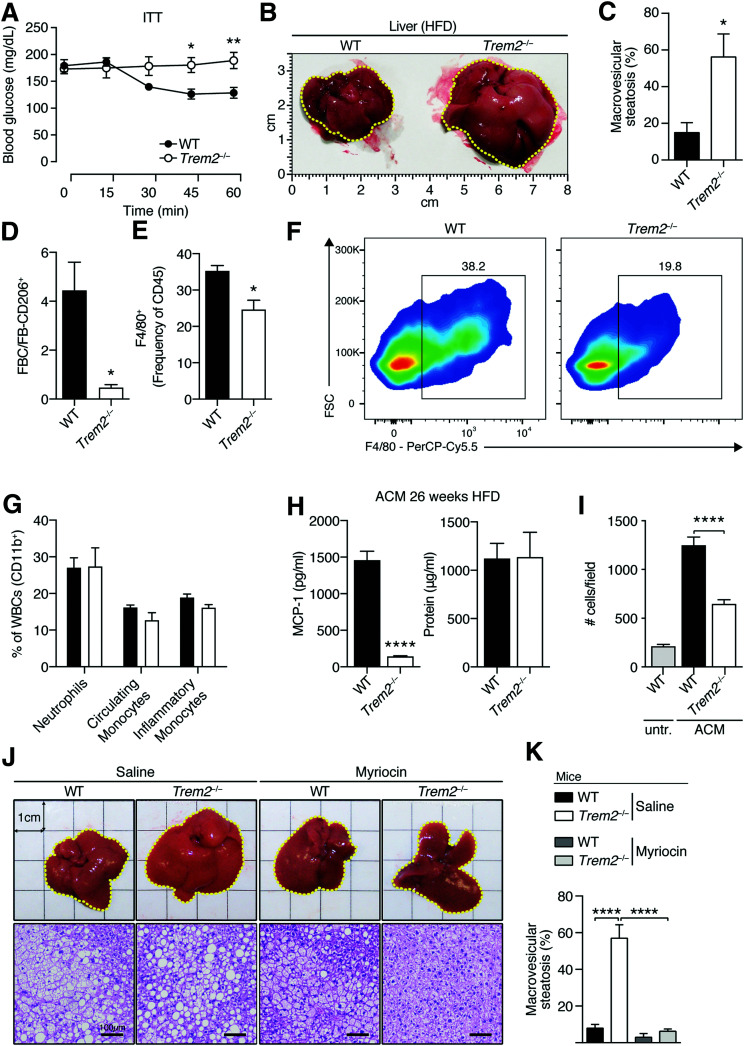
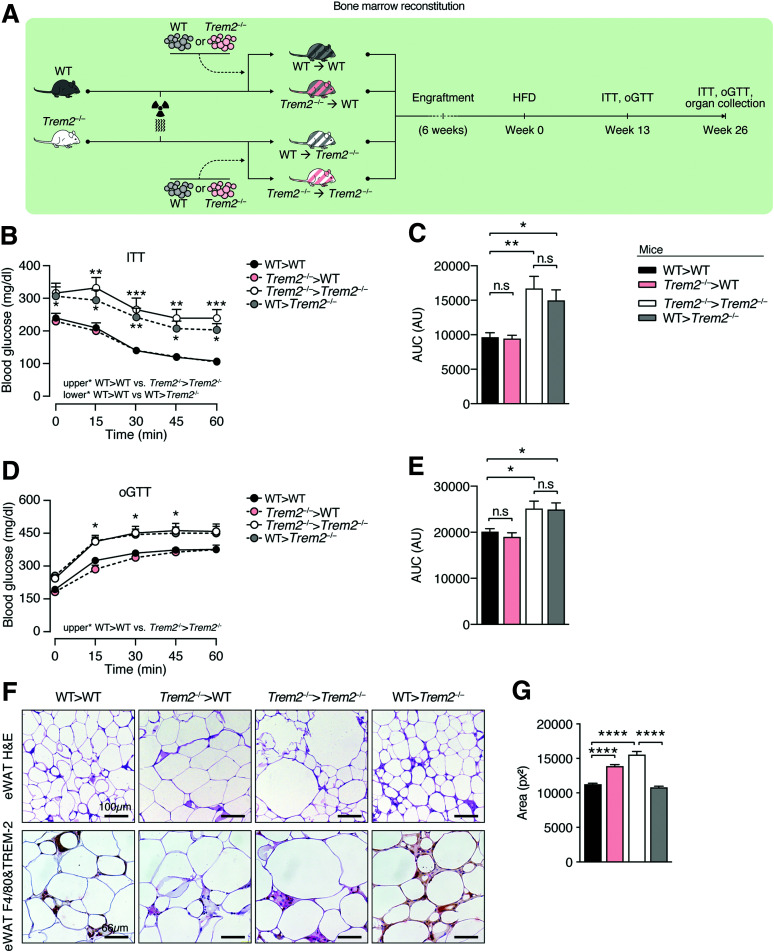
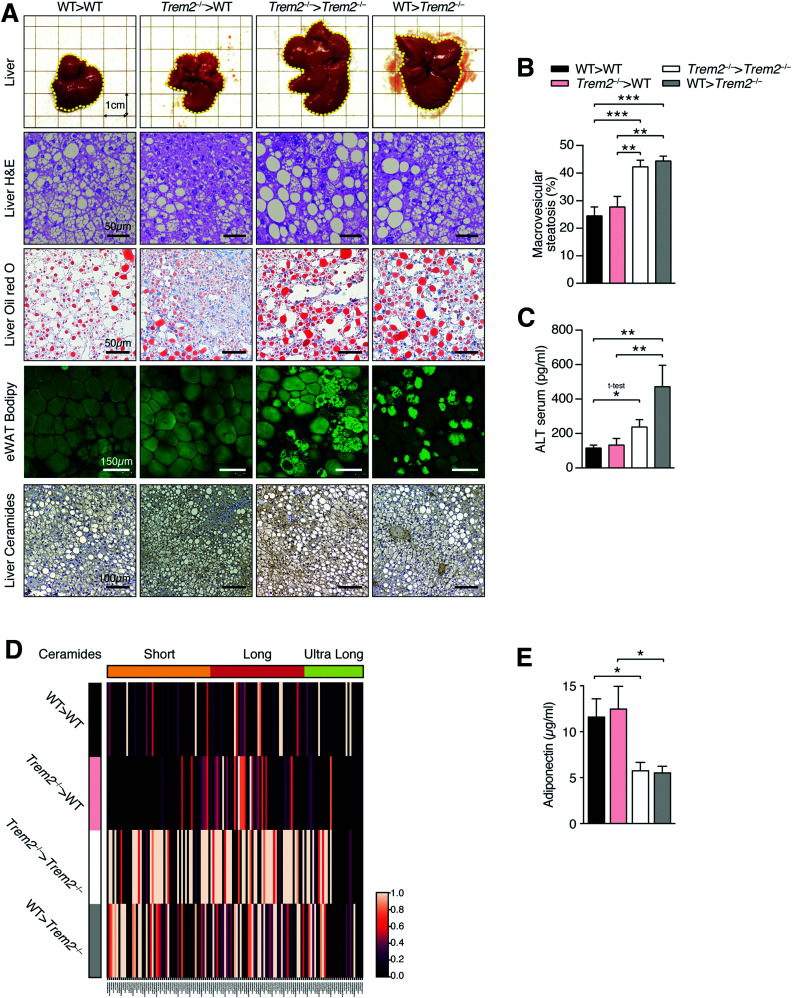
Obesity-induced white adipose tissue (WAT) hypertrophy is associated with elevated adipose tissue macrophage (ATM) content. Overexpression of the triggering receptor expressed on myeloid cells 2 (TREM2) reportedly increases adiposity, worsening health. Paradoxically, using insulin resistance, elevated fat mass, and hypercholesterolemia as hallmarks of unhealthy obesity, a recent report demonstrated that ATM-expressed TREM2 promoted health. Here, we identified that in mice, TREM2 deficiency aggravated diet-induced insulin resistance and hepatic steatosis independently of fat and cholesterol levels. Metabolomics linked TREM2 deficiency with elevated obesity-instigated serum ceramides that correlated with impaired insulin sensitivity. Remarkably, while inhibiting ceramide synthesis exerted no influences on TREM2-dependent ATM remodeling, inflammation, or lipid load, it restored insulin tolerance, reversing adipose hypertrophy and secondary hepatic steatosis of TREM2-deficient animals. Bone marrow transplantation experiments revealed unremarkable influences of immune cell-expressed TREM2 on health, instead demonstrating that WAT-intrinsic mechanisms impinging on sphingolipid metabolism dominate in the systemic protective effects of TREM2 on metabolic health.


Figures

Figure 1
Figure 1
Conserved visceral adipose upregulation of TREM2 in obesity. A: Trem2 expression in organs 13 weeks post-HFD. B: Trem2 expression in visceral and subcutaneous adipose depots 13 weeks post-HFD. C: Trem2 expression in ATMs and MA. D: Immunohistochemistry of eWAT depicting TREM2 13 weeks post-HFD. E: Trem2 expression in human visceral adipose biopsies obtained from individuals who were obIS and obIR. Bar graph bar data are mean ± SEM (n = 4 per diet). Statistical analysis was performed with Mann-Whitney U test (A and B) or two-way ANOVA followed by Bonferroni posttest (E). *P < 0.05, **P < 0.01, ****P < 0.0001. RP, retroperitoneal.
Figure 2
Figure 2
TREM2 deficiency aggravates obesity-induced insulin resistance. A: Insulin tolerance test (ITT) of WT and Trem2–/– mice 13 weeks post-HFD (n = 8 per genotype). B: Area under the curve (AUC) of panel A. C: Oral glucose tolerance test (oGTT) of WT and Trem2–/– mice 13 weeks post-HFD (n = 8 per genotype). D: Adipose weights 13 weeks post-HFD of animals in panel C. E: Mouse weights 13 weeks post-HFD of animals in panels C and D. FH: Energy expenditure and activity of control and Trem2–/– mice 13 weeks post-HFD (n = 4 per genotype). Data are mean ± SEM and are pooled for panels AE from two independent experiments. Statistical analysis was performed with two-way ANOVA followed by Bonferroni posttest (A and C), Student t test (B and D), or one-way ANOVA followed by Tukey posttest (G). *P < 0.05, **P < 0.01. AU, arbitrary unit; RP, retroperitoneal; SAT, subcutaneous adipose tissue; VAT, visceral adipose tissue.
Figure 3
Figure 3
Elevated adipose hypertrophy of obese TREM2-deficient animals is associated with ATM remodeling. A: Representative hematoxylin-eosin staining of eWAT of WT and Trem2–/– mice 13 weeks post-HFD (n = 8 mice per genotype). B: Quantification of adipocyte cell size of WT and Trem2–/– mice 13 weeks post-HFD (n = 8 mice per genotype, and data correspond to size quantification of 3,492 WT and 2,103 Trem-2–/– adipocytes). C: Absolute macrophage content (defined as viable CD45+F4/80+CD11b+ cells) in eWAT of both genotypes of animals following 13 weeks of feeding under both dietary conditions (n = 4 mice per condition). D: Percentage of macrophages (defined as viable CD45+F4/80+ cells) in eWAT of both genotypes of animals 13 weeks post-HFD (n = 4 mice per genotype). E: Ratio of FBC (viable CD45+F4/80+CD11b+CD11c+CD206 cells) vs. FB206 (viable CD45+F4/80+CD11b+CD206+ cells) in eWAT of both genotypes of animals following 13 weeks of feeding under both dietary conditions (n = 4 mice per genotype). F: Percentage within the parent FB population of CD206+, CD11c+, and CD206+CD11c+ ATMs in both genotypes of obese animals 13 weeks post-HFD (n = 4 mice per genotype). G: Representative flow cytometry plots of panel F. Bar graph data are mean ± SEM and are pooled for panels A and B from two independent experiments. Data in panels EG are representative of two independent experiments. Statistical analysis was performed with Student t test (B, D, and F) or one-way ANOVA followed by Tukey posttest (C and E). *P < 0.05, **P < 0.01, ****P < 0.0001. px2, square pixels.
Figure 4
Figure 4
Metabolic stress is required for the protective effects of TREM2, which are linked to elevated sphingolipids levels. A: Log2 fold change (FC) in metabolite abundance for Trem2–/– over WT mice averaged over both dietary conditions compared with log2(FC) metabolite levels of HFD over ND averaged over both genetic groups (n = 3 or 4 mice per genotype following 14 weeks of ND or HFD, respectively). B: Glucose levels (x-axis) vs. relative abundance of selected lipids (y-axis) following 45 and 60 min of insulin challenge. Dots represent mice, colored as indicated in the key. C: Activation of liver AKT signaling 5 min post–insulin injection in both genotypes fed an HFD for 13 weeks. D: Scheme for sphingolipid blockage. WT or Trem2–/– mice were placed on an HFD for 13 or 26 weeks. Eight weeks post-DIO, mice were injected three times weekly with saline control or myriocin at a dose of 0.5 mg/kg and maintained on an HFD. E: Log2FC in average abundance of short-, long-, and ultra-long-chain ceramides for both genotypes of myriocin-treated animals compared with saline controls (n = 4 mice per condition 26 weeks post-HFD). F: Insulin tolerance test (ITT) of both genotypes of mice in the context of sphingolipid blockage 13 weeks post-HFD (n = 8–9 mice per condition). G: Area under the curve (AUC) and mouse weights of data in panel F. H: Representative hematoxylin-eosin staining of eWAT 13 weeks post-HFD of animals in panels F and G (n = 8–9 mice per condition). I: Quantification of adipocyte cell size in panel H. Data are mean ± SEM. Statistical analysis was performed with two-way ANOVA followed by Bonferroni posttest (F) or one-way ANOVA followed by Tukey posttest (G and I). *P < 0.05, **P < 0.01, ***P < 0.001, ****P < 0.0001. MW, molecular weight; oGTT, oral glucose tolerance test; px2, square pixels.
Figure 5
Figure 5
Sphingolipid blockage exerts no effects on the ATM compartment of Trem2–/– mice. A: Absolute eWAT macrophage content of both genotypes of animals (defined as viable CD45+F4/80+CD11b+ cells) in the context of sphingolipid blockage 13 weeks post-HFD (n = 5 mice per condition). B and C: Percentage within the parent FB population of CD206+ and CD11c+ ATMs in both genotypes of obese animals 13 weeks post HFD in the context of sphingolipid blockage (n = 5 mice per condition). D: ATM-mediated polarization and inflammation from flow-assisted cell-sorted viable CD45+CD3-F4/80+CD11b+ cells of both genotypes of animals in the context of sphingolipid blockage 13 weeks post-HFD (n = 3–5 mice per condition). Data are fold change relative to WT saline animals. E: Percentage of macrophages (defined as viable CD45+F4/80+CD11b+ cells) in eWAT of both genotypes of animals in the context of sphingolipid blockage 13 weeks post-HFD (n = 3–5 mice per condition). F: Percentage of BODIPY+ macrophages (defined as viable BODIPY+CD45+F4/80+CD11b+ cells) in eWAT of both genotypes of animals in the context of sphingolipid blockage 13 weeks post-HFD (n = 3–5 mice per condition). Data are mean ± SEM. Statistical analysis was performed with one-way ANOVA followed by Tukey posttest (AC, E, and F). *P < 0.05, ****P < 0.0001.
Figure 6
Figure 6
TREM2 exerts protective effects in sphingolipid-mediated secondary liver steatosis associated with specific defects in visceral ATM content. A: Insulin tolerance test (ITT) 26 weeks post-HFD (n = 4 per genotype). B: Liver size 26 weeks post-HFD (n = 4 per genotype). C: Liver steatosis 26 weeks post-HFD (n = 4 per genotype). D: Ratio of FBC (viable CD45+F4/80+CD11b+CD11c+ cells) vs. FB206 (viable CD45+F4/80+CD11b+CD206+ cells) in eWAT of both genotypes of animals 26 weeks post-HFD (n = 4 mice per genotype). E: Percentage of macrophages (viable CD45+Ly6GF4/80+) in eWAT 26 weeks post-HFD (n = 4 per genotype). F: Representative flow cytometry plots of panel E. G: Percentage of white blood cells (WBCs) evaluated using flow cytometry 26 weeks post-HFD (n = 4 per genotype). H: MCP-1 levels and protein content in ACM derived from WT and Trem2–/– mice 26 weeks post-HFD (n = 5 mice per genotype). I: Migration levels of BM macrophages induced by ACM in panel H (n = 4 per condition). J: Representative liver morphology and hematoxylin-eosin staining 26 weeks post-HFD in the context of sphingolipid blockage (n = 4–5 mice per genotype). K: Liver steatosis 26 weeks post-HFD in the context of sphingolipid blockage (n = 4–5 mice per genotype). Data are mean ± SEM. Data in panels AF, H, and I are representative of two independent experiments. Statistical analysis was performed with two-way ANOVA followed by Bonferroni posttest (A), Student t test (CE and H), or one-way ANOVA followed by Tukey posttest (I and K). *P < 0.05, **P < 0.01, ****P < 0.0001. untr., untreated.
Figure 7
Figure 7
Uncoupling of effects of hematopoietic-expressed TREM2 on adipose hypertrophy and metabolic health. A: Scheme for BM transplantation studies. WT or Trem2–/– mice were lethally irradiated and transplanted with either WT or Trem2–/– BM to generate four groups of mice: WT>WT, Trem2–/–>Trem2–/– or Trem2–/–>WT, and WT>Trem2–/–. Posttransplant mice were maintained on an ND for 6 weeks, following which DIO was instigated. B: Insulin tolerance test (ITT) 13 weeks post-HFD. C: Area under the curve (AUC) of data in panel B. D: Oral glucose tolerance test (oGTT) 13 weeks post-HFD. E: AUC of data in panel D. F: Representative hematoxylin-eosin (H&E), TREM2, and F4/80 staining of eWAT of BM-transplanted mice 26 weeks post-HFD. G: Quantification of adipocyte cell size in H&E staining from panel F. Data correspond to size quantification of 3,868, 3,147, 3,198, and 4,412 adipocytes in WT>WT, Trem2–/–>WT, Trem2–/–>Trem2–/–, and WT>Trem2–/– mice, respectively. Data are mean ± SEM and are pooled from two independent experiments (n = 10–13 mice per genotype). Statistical analysis was performed with two-way ANOVA followed by Bonferroni posttest (B and D) or one-way ANOVA followed by Tukey posttest (C, E, and G). *P < 0.05, **P < 0.01, ***P < 0.01, ****P < 0.0001. AU, arbitrary unit; px2, square pixels.
Figure 8
Figure 8
Effects of TREM2 on hepatic steatosis are linked to nonhematopoietic tissue and elevated adipose ceramide levels. A: Liver aspects and stainings of representative liver sections (hematoxylin-eosin [H&E], oil red O, ceramide) and representative whole mount of eWAT of BM-transplanted mice 26 weeks post-HFD. B: Liver steatosis in groups of BM-transplanted mice 26 weeks post-HFD. C: Serum levels of ALT 26 weeks post-HFD. D: Average abundance of short-, long-, and ultra-long-chain ceramide species in eWAT of BM-transplanted mice 26 weeks post-HFD. Individual ceramide abundances scaled between 0 (minimum) and 1 (maximum) (n = 4 mice per genotype). E: Serum adiponectin levels 26 weeks post-HFD. Data are mean ± SEM (B, C, and E) and pooled from two independent experiments (n = 10–13 mice per genotype). Statistical analysis was performed with one-way ANOVA followed by Tukey posttest (B, C, and E). *P < 0.05, **P < 0.01, ***P < 0.01.

Comment in

References

    1. Rutkowski JM, Stern JH, Scherer PE. The cell biology of fat expansion. J Cell Biol 2015;208:501–512 - PMC - PubMed
    1. Kanda H, Tateya S, Tamori Y, et al. . MCP-1 contributes to macrophage infiltration into adipose tissue, insulin resistance, and hepatic steatosis in obesity. J Clin Invest 2006;116:1494–1505 - PMC - PubMed
    1. Kamei N, Tobe K, Suzuki R, et al. . Overexpression of monocyte chemoattractant protein-1 in adipose tissues causes macrophage recruitment and insulin resistance. J Biol Chem 2006;281:26602–26614 - PubMed
    1. Lumeng CN, Bodzin JL, Saltiel AR. Obesity induces a phenotypic switch in adipose tissue macrophage polarization. J Clin Invest 2007;117:175–184 - PMC - PubMed
    1. Patsouris D, Li PP, Thapar D, Chapman J, Olefsky JM, Neels JG. Ablation of CD11c-positive cells normalizes insulin sensitivity in obese insulin resistant animals. Cell Metab 2008;8:301–309 - PMC - PubMed

Publication types