. 2021 Jul;11(7):1826-1843.
doi: 10.1158/2159-8290.CD-20-1571. Epub 2021 Feb 24.

Loss of Optineurin Drives Cancer Immune Evasion via Palmitoylation-Dependent IFNGR1 Lysosomal Sorting and Degradation

Affiliations

Loss of Optineurin Drives Cancer Immune Evasion via Palmitoylation-Dependent IFNGR1 Lysosomal Sorting and Degradation

Wan Du et al. Cancer Discov. 2021 Jul.

Abstract

Mutations in IFN and MHC signaling genes endow immunotherapy resistance. Patients with colorectal cancer infrequently exhibit IFN and MHC signaling gene mutations and are generally resistant to immunotherapy. In exploring the integrity of IFN and MHC signaling in colorectal cancer, we found that optineurin was a shared node between the two pathways and predicted colorectal cancer patient outcome. Loss of optineurin occurs in early-stage human colorectal cancer. Immunologically, optineurin deficiency was shown to attenuate IFNGR1 and MHC-I expression, impair T-cell immunity, and diminish immunotherapy efficacy in murine cancer models and patients with cancer. Mechanistically, we observed that IFNGR1 was S-palmitoylated on Cys122, and AP3D1 bound with and sorted palmitoylated IFNGR1 to lysosome for degradation. Unexpectedly, optineurin interacted with AP3D1 to prevent palmitoylated IFNGR1 lysosomal sorting and degradation, thereby maintaining IFNγ and MHC-I signaling integrity. Furthermore, pharmacologically targeting IFNGR1 palmitoylation stabilized IFNGR1, augmented tumor immunity, and sensitized checkpoint therapy. Thus, loss of optineurin drives immune evasion and intrinsic immunotherapy resistance in colorectal cancer. SIGNIFICANCE: Loss of optineurin impairs the integrity of both IFNγ and MHC-I signaling pathways via palmitoylation-dependent IFNGR1 lysosomal sorting and degradation, thereby driving immune evasion and intrinsic immunotherapy resistance in colorectal cancer. Our work suggests that pharmacologically targeting IFNGR1 palmitoylation can stabilize IFNGR1, enhance T-cell immunity, and sensitize checkpoint therapy in colorectal cancer.See related commentary by Salvagno and Cubillos-Ruiz, p. 1623.This article is highlighted in the In This Issue feature, p. 1601.


Conflict of interest statement

Conflict of interest: W.Z. has served as a scientific advisor for Cstone, Oncopia, and Hengenix.

Figures

Figure 1.
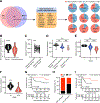
Figure 1.. Tumor optineurin correlates with immunotherapy efficacy and patient outcome
A, Overlapping genes between the IFNγ- and MHC-I signaling pathways in human colorectal cancer in TCGA data set. (Left panel) Based on log FC > 0 and P values, top individual genes (500) and shared genes (322) were identified in the IFN-signaling and MHC-I signatures in TCGA data set. (Middle panel) Among the shared 322 genes, based on protein expression score in The Human Protein Atlas, 15 proteins with high expression score were identified in normal colorectal tissues. (Right panel) Proteomic analysis detected 9 out of 15 proteins in the paired colon cancer tissues and adjacent normal colon tissues. Sector graph represents the percentage of clinical cases with high and low expression of indicated proteins in colon cancer tissues, relative to paired adjacent normal colon tissues (n = 96). B and C, Optineurin protein expression in normal colorectal tissues and colorectal cancer tissues. (B) Optineurin protein expression in normal colorectal tissues (n = 30) and colorectal adenocarcinoma tissues (n = 90) based on proteogenomic analysis. Two tailed t-tests, ****P < 0.0001. (C) Optineurin expression detected by immunohistochemistry staining in colorectal cancer tissues and paired adjacent normal colorectal tissues (cohort 1) (n = 66). Optineurin expression was quantified by H-score method. Paired t-tests, ***P < 0.001 D, Optineurin protein expression determined by immunohistochemistry staining in normal colorectal tissues (n = 16), colorectal adenoma tissues (n = 35), and colorectal cancer tissues (n = 9) (cohort 2). Optineurin expression was quantified by H-score method. Two tailed t-tests, **P < 0.01. NS: not significant. P = 0.1741. E, Optineurin expression in different histological grades of colorectal cancer (n = 92) (cohort 1). Two tailed t-tests, **P < 0.01, ***P < 0.001. NS: not significant. P = 0.1067. F and G, Optineurin protein expression detected by immunohistochemistry staining in colorectal cancer tissues (cohort 3) (n = 78). (F) Optineurin expression in early (I and II) versus late (III and IV) TNM stages in colorectal cancer. Two tailed t-tests, ***P < 0.001. (G) Survival was analyzed and compared between patients with low (n = 39) and high (n = 39) levels of optineurin in colorectal cancer. Log-rank test. H and I, Relationship between optineurin protein expression and immunotherapy efficacy in melanoma patients. (H) The clinical response rates to anti-PD-1 therapy in melanoma patients with high and low optineurin expression are shown. Clinical beneficial group (CB), including complete response (CR) (n = 10) and partial response (PR) (n = 30); No clinical beneficial group (NCB), including progressive disease (PD) (n = 27). Chi-square test, ***P < 0.001. (I) Survival was analyzed and compared between patients with low (n = 34) and high (n = 33) levels of optineurin in melanoma patients treated with anti-PD-1 therapy. Log-rank test.
Figure 2.
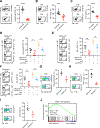
Figure 2.. Optineurin affects tumor immunity and immunotherapy efficacy
A and B, Effect of optineurin knocking down on murine colorectal tumor growth. Tumor growth was monitored in syngeneic wild type mice bearing scramble and sh-optineurin expressing MC38 cells (A) and CT26 cells (B). Mean ± SEM. n = 8 or 9 /group (A) and n = 10 /group (B). ****P < 0.0001 on day 30 (A) and day 22 (B) (two-way ANOVA). C - E, Effect of optineurin knock out (optineurin−/−) on MC38 tumor growth. Tumor growth was monitored in C57/BL6 wild type mice bearing optineurin+/+ and optineurin−/− MC38 cells. Tumor volume (C), weight (D), and images (E) are shown. Mean ± SEM, n = 10 /group. **** P < 0.0001 on day 30 (two-way ANOVA). Scale bars,1 cm (E). F and G, Effect of IEC-optineurin knock-out on murine colorectal tumorigenesis in AOM/DSS model. Tumor numbers, size (F), and images (G) are shown. n = 6 /group. Two tailed t-test, **P < 0.01. Scale bars, 2 mm (G). H, Effect of optineurin knock out on immunotherapy efficacy in MC38 tumor bearing mice. Mice bearing optineurin+/+ and optineurin−/− MC38 tumors were treated with anti-PD-L1 mAb. *P < 0.05, **P < 0.01, ***P < 0.01 on day 16 (two-way ANOVA).
Figure 3.
Figure 3.. Optineurin impacts cytotoxic T cell activation and function in vivo
A - C, Effect of tumor optineurin knocking down on CT26 tumor infiltrating T cell function. Sh-optineurin and scrambled shRNA expressing CT26 cells were inoculated into BALB/c mice. The percentages of tumor infiltrating granzyme B+ (A), TNFα+ (B), and IFNγ+ (C) CD8+ T cells were analyzed by flow cytometry. Mean ± SEM, n = 9 /group. Two tailed t-tests, ***P < 0.001, ****P < 0.0001. D - F, Effect of tumor optineurin deficiency on MC38 tumor infiltrating T cell function. Optineurin+/+ and optineurin−/− expressing MC38 cells were inoculated into C57/BL6 mice. The percentages of tumor infiltrating granzyme B+ (D), TNFα+ (E), and IFNγ+ (F) CD8+ T cells were analyzed by flow cytometry. Mean ± SEM, n = 4–5 /group. Two tailed t-tests, *P < 0.05, **P < 0.01. G - I, Effect of IEC-optineurin deficiency on T cell function in AOM/DSS model. The percentages of granzyme B+ (G), TNFα+ (H), and IFNγ+ (I) CD8+ T cells in LPMCs were analyzed by flow cytometry. n = 3 /group. Two tailed t-tests, *P < 0.05, **P < 0.01. J, Correlation of optineurin protein expression with effector T cell signaling signature in melanoma patients treated with anti-PD1 therapy (n = 67).
Figure 4.
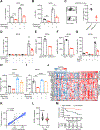
Figure 4.. Optineurin deficiency impairs IFNGR1 expression and antigen presentation
A and B, Effect of optineurin deficiency on H-2Kb expression in MC38 cells. Optineurin+/+ and optineurin−/− MC38 cells were treated with IFNγ for 24 hours. (A) H-2Kb mRNAs were quantified by qRT-PCR. Mean ± SEM, two tailed t-tests, ***P < 0.001. (B) H-2Kb protein expression was determined by flow cytometry analysis. Results are shown as mean fluorescence intensity (MFI). Mean ± SEM, two tailed t-tests, *P < 0.05, **P < 0.01. C, Effect of IEC-optineurin deficiency on H-2Kb expression in AOM/DSS model. The percentages of H-2Kb+ epithelial cellswere analyzed by flow cytometry. Mean ± SEM, n = 3 /group. Two tailed t-tests. **P < 0.01. D, Effect of tumor optineurin expression on OT-I-mediated tumor killing. OVA expressing optineurin+/+ and optineurin−/− MC38 cells were co-cultured with OT-I cells for 24 hours. Tumor cell apoptosis was determined by flow cytometry analysis. Results are shown as the percentages of 7-AAD+ tumor cells. n = 3 biological replicates. Mean ± SEM, two tailed t-tests, ** P < 0.01. E, Effect of tumor optineurin expression on SIINFEKL-H-2Kb complex. SIINFEKL-H-2Kb expression was quantified by flow cytometry on OVA-expressing optineurin+/+ or optineurin−/− MC38 cells. Results are expressed as MFI. Mean ± SEM, two tailed t-tests, **P < 0.01. F, Effect of tumor Ifngr1 expression on SIINFEKL- H-2Kb complex. SIINFEKL- H-2Kb expression on OVA-expressing Ifngr1+/+ or Ifngr1−/− MC38 cells was quantified by flow cytometry. Results are expressed as MFI. Mean ± SEM, two tailed t-tests, ****P < 0.0001. G, Effect of tumor Ifngr1 expression on OT-I-mediated tumor killing. OVA expressing Ifngr1+/+ and Ifngr1 −/− MC38 cells were co-cultured with OT-I cells for 24 hours. Tumor cell apoptosis was determined by flow cytometry analysis. Results are shown as the percentages of 7-AAD+ tumor cells. n = 3 biological replicates. Mean ± SEM, two tailed t-tests, ****P < 0.0001. H, Effect of tumor Ifngr1 on SIINFEKL- H-2Kb complex in optineurin−/− MC38 cells. SIINFEKL- H-2Kb expression on OVA-expressing optineurin+/+ or optineurin−/− MC38 cells with or without ectopic Ifngr1 expression was quantified by flow cytometry. Results are expressed as MFI. n = 3 biological replicates. Mean ± SEM, two tailed t-tests, ***P < 0.001. I, Effect of tumor Ifngr1 expression on OT-I-mediated tumor killing in optineurin−/− MC38 cells. OVA expressing optineurin+/+ and optineurin−/− MC38 cells with or without ectopic Ifngr1 expression were co-cultured with OT-I cells for 24 hours. Tumor cell apoptosis was determined by flow cytometry analysis. Results are shown as the percentages of 7-AAD+ tumor cells. n = 3 biological replicates. Mean ± SEM, two tailed t-tests, **P < 0.01, ****P < 0.0001. J, Correlation of optineurin protein expression with the MHC complex and IFNγ-signaling genes. Heatmap shows MHC complex proteins and IFNγ-signaling proteins in melanoma patients treated with anti-PD1 therapy (n = 67). Each color represents differential gene expression: red represents high expression; blue represents low expression. K, Correlation of optineurin and IFNGR1 protein expression in colorectal cancer tissues. Pearson correlation analysis. Expression of optineurin and IFNGR1 was determined by immunohistochemistry and expressed as H-score. Cohort 3, n = 78. L and M, Pathological and clinical impact of tumor IFNGR1 protein on patients with colorectal cancer. IFNGR1 protein was examined by immunohistochemistry staining. (L) IFNGR1 expression in different stages of colorectal cancer patients. Cohort 3, n = 78, two tailed t-tests, ****P < 0.0001. (M) Survival was analyzed and compared between patients with low (n = 39) and high (n = 39) levels of IFNGR1 in colorectal cancer. Log-rank test. Cohort 3, n = 78.
Figure 5.
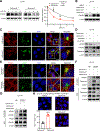
Figure 5.. Loss of optineurin promotes IFNGR1 lysosomal sorting via AP3D1
A - C, Role of optineurin in IFNGR1 degradation. (A) Optineurin+/+ and optineurin−/− LS174T cells were treated with cycloheximide (CHX). Immunoblots revealed IFNGR1 expression bands (left) and relative band intensities (right) at different time points. One of 3 replicates is shown. (B) Optineurin+/+ and optineurin−/− LS174T cells were treated with Bafilomycin for 4 hours. Immunoblots showed IFNGR1 expression. One of 3 replicates is shown. (C) Effect of optineurin on tumor IFNGR1 lysosomal localization. Optineurin+/+ and optineurin−/− DLD1 cells were stained for IFNGR1 (Red) and LAMP1 (Green). Cell nucleus (Blue) was stained with 4′,6-diamidino-2-phenylindole (DAPI). Representative immunofluorescence images exhibit the co-localization of IFNGR1 and LAMP1. Scale bars, 5 μm. n = 3 biological replicates. D, Effect of AP3D1 on IFNGR1 expression. IFNGR1 expression in sh-AP3D1 and scrambled shRNA expressing optineurin+/+ and optineurin−/− LS174T cells. Immunoblots showed IFNGR1 expression. n = 3 biological replicates. E, Effect of AP3D1 on IFNGR1 localization. IFNGR1 (Red) and LAMP1 (Green) stained in sh-AP3D1 and scrambled shRNA expressing optineurin−/− DLD1 cells. Representative immunofluorescence images exhibit the co-localization of IFNGR1 and LAMP1. Cell nucleus (Blue) was stained with DAPI. Scale bars, 5 μm. n = 3 biological replicates. F - H, Effect of optineurin expression on the interaction between IFNGR1 and AP3D1. (F and G) Detection of endogenous IFNGR1 and AP3D1 binding by Co-IP. Proteins in optineurin+/+ and optineurin−/− LS174T cells were immunoprecipitated using anti-AP3D1 antibody (F) or anti-IFNGR1 antibody (G), and immunoblotted using anti-IFNGR1 and anti-AP3D1. Cells were treated with Bafilomycin (100 μM) for 4 hours. Whole-cell lysate (WCL). n = 3 biological replicates. (H) Detection of endogenous IFNGR1 and AP3D1 binding (red dots) by Duolink assay. The number of red dots was divided by the number of nuclei. Three biological replicates were performed. Scale bar, 7 μm. Mean ± SEM, two tailed t-tests, *** P < 0.001.
Figure 6.
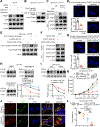
Figure 6.. IFNGR1 palmitoylation alters the IFNGR1-AP3D1 interaction and tumor immunity
A, Effect of 2-BP on IFNGR1, IL6R, and TNFR1 expression in LS174T cells. Optineurin+/+ and optineurin−/− LS174T cells were treated with 2-BP for 4 hours. IFNGR1, IL6R, and TNFR1 expression was detected by immunoblots. One of 3 experiments is shown. B, Detection of IFNGR1 palmitoylation in optineurin−/− LS174T cells. Optineurin−/− LS174T cells were treated and prepared for the Click-iT reaction. One of 3 replicates is shown. C and D, Effect of 2-BP on the interaction between IFNGR1 and AP3D1. (C) Detection of endogenous IFNGR1 and AP3D1 binding by Co-IP. Optineurin−/− LS174T cells were treated with or without 2-BP and Bafilomycin for 4 hours. Proteins were collected from these cells and were immunoprecipitated using AP3D1 antibody and immunoblotted using anti-IFNGR1. Whole-cell lysate (WCL). n = 3 biological replicates. (D) Detection of endogenous IFNGR1 and AP3D1 binding (red dots) by Duolink assay. Optineurin−/− DLD1 cells were treated with or without 2-BP for 2 hours. The number of red dots was divided by the number of nuclei. Three biological replicates were performed. Scale bar, 7 μm. Two tailed t-tests, ** P < 0.01. E, Identification of IFNGR1 palmitoylation site. Optineurin−/− LS174T cells were ectopically expressed with wild type IFNGR1-DDK (WT) or IFNGR1 C122A mutant -DDK (C122A) plasmid, and treated and prepared for the Click-iT reaction. One of 3 replicates is shown. F and G, Effect of C122A mutation on the interaction between IFNGR1 and AP3D1. (F) Detection of the interaction of IFNGR1 and AP3D1 by Co-IP. 293T cells were transfected with AP3D1-tGFP plasmid, IFNGR1-DDK wild type (WT) plasmid, or IFNGR1-DDK C122A mutant plasmid. Proteins were isolated from these cells, immunoprecipitated using anti-DDK antibody, and immunoblotted using anti-tGFP. n = 3 biological replicates. (G) Detection of the interaction (red dots) of AP3D1 with IFNGR1-WT or IFNGR1-C122A by Duolink assay. Optineurin−/− DLD1 cells were transfected with AP3D1-tGFP plasmid, IFNGR1-DDK WT plasmid, or IFNGR1-DDK C122A mutant plasmid for 48 hours. The number of red dots was divided by the number of nuclei. Three biological replicates were performed. Scale bar, 7 μm. Two tailed t-tests, ** P < 0.01. H, Effect of palmitoylation on IFNGR1 degradation in LS174T cells. LS174T cells were treated with CHX in the presence of Palmostatin B and Palmostatin B plus Bafilomycin. Immunoblots showed IFNGR1 protein expression bands and band intensity at different time points. One of 3 experiments is shown. I, Effect of C122A mutation on IFNGR1 stability in LS174T cells. Optineurin−/− LS174T cells were ectopically expressed with WT IFNGR1-DDK or IFNGR1 C122A-DDK plasmid, and cultured with CHX. Immunoblots showed IFNGR1-DDK band and band intensities at the indicated time points. One of 3 replicates is shown. J, Effect of C122A mutation on tumor IFNGR1 lysosomal localization. Optineurin−/− DLD1 cells were ectopically expressed with wild type IFNGR1 or C122A mutants, and stained for IFNGR1 (Red) and LAMP1 (Green). Representative immunofluorescence images showed the co-localization of IFNGR1 and LAMP1. Cell nucleus (Blue) was stained with DAPI. Scale bars, 5 μm. n = 3 biological replicates. K and L, Effect of cerulenin and anti-PD-L1 mAb therapy on colon tumor progression. Mice bearing sh-optineurin CT26 tumor was treated with cerulenin, anti-PD-L1, or their combination. Tumor volume (K) and weight (L) are shown. Mean ± SEM, n = 5 /group. ** P < 0.01, **** P < 0.0001 on day 18 (two-way ANOVA).

Comment in

References

    1. Topalian SL, Drake CG, Pardoll DM. Immune checkpoint blockade: a common denominator approach to cancer therapy. Cancer Cell 2015;27(4):450–61. - PMC - PubMed
    1. Zou W, Wolchok JD, Chen L. PD-L1 (B7-H1) and PD-1 pathway blockade for cancer therapy: Mechanisms, response biomarkers, and combinations. Sci Transl Med 2016;8(328):328rv4. - PMC - PubMed
    1. Gryfe R, Kim H, Hsieh ET, Aronson MD, Holowaty EJ, Bull SB, et al. Tumor microsatellite instability and clinical outcome in young patients with colorectal cancer. N Engl J Med 2000;342(2):69–77. - PubMed
    1. Koopman M, Kortman GA, Mekenkamp L, Ligtenberg MJ, Hoogerbrugge N, Antonini NF, et al. Deficient mismatch repair system in patients with sporadic advanced colorectal cancer. Br J Cancer 2009;100(2):266–73. - PMC - PubMed
    1. Boland CR, Goel A. Microsatellite instability in colorectal cancer. Gastroenterology 2010;138(6):2073–87.e3. - PMC - PubMed

Publication types