

Islet expression of type I interferon response sensors is associated with immune infiltration and viral infection in type 1 diabetes
- PMID: 33627420
- PMCID: PMC7904254
- DOI: 10.1126/sciadv.abd6527
Islet expression of type I interferon response sensors is associated with immune infiltration and viral infection in type 1 diabetes
Abstract
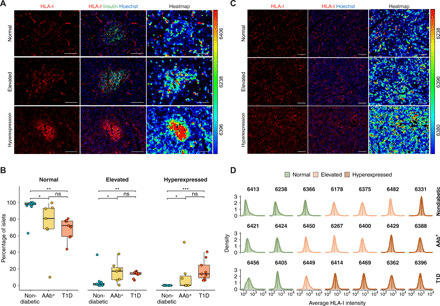
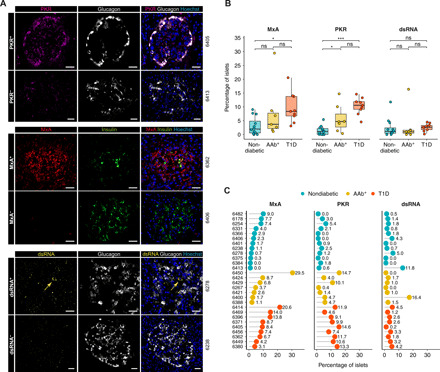
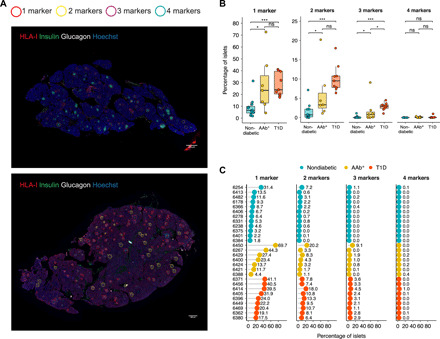
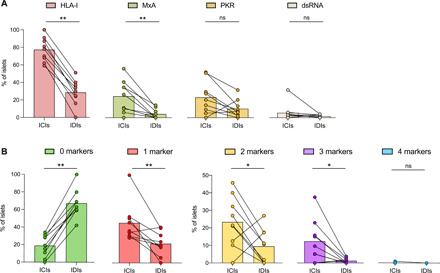
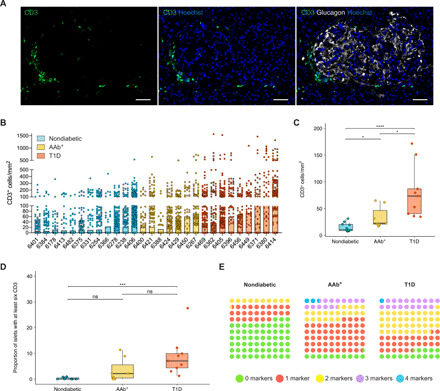
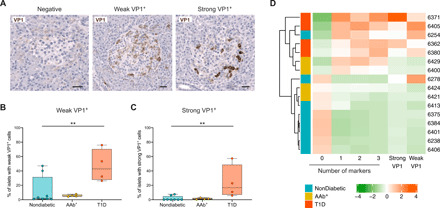
Previous results indicate the presence of an interferon (IFN) signature in type 1 diabetes (T1D), capable of inducing chronic inflammation and compromising b cell function. Here, we determined the expression of the IFN response markers MxA, PKR, and HLA-I in the islets of autoantibody-positive and T1D donors. We found that these markers can be coexpressed in the same islet, are more abundant in insulin-containing islets, are highly expressed in islets with insulitis, and their expression levels are correlated with the presence of the enteroviral protein VP1. The expression of these markers was associated with down-regulation of multiple genes in the insulin secretion pathway. The coexistence of an IFN response and a microbial stress response is likely to prime islets for immune destruction. This study highlights the importance of therapeutic interventions aimed at eliminating potentially persistent infections and diminishing inflammation in individuals with T1D.
Copyright © 2021 The Authors, some rights reserved; exclusive licensee American Association for the Advancement of Science. No claim to original U.S. Government Works. Distributed under a Creative Commons Attribution NonCommercial License 4.0 (CC BY-NC).
Figures
Similar articles
-
Detection of Antiviral Tissue Responses and Increased Cell Stress in the Pancreatic Islets of Newly Diagnosed Type 1 Diabetes Patients: Results From the DiViD Study.Front Endocrinol (Lausanne). 2022 Jul 26;13:881997. doi: 10.3389/fendo.2022.881997. eCollection 2022. Front Endocrinol (Lausanne). 2022. PMID: 35957810 Free PMC article.
-
Enteroviral infections are not associated with type 2 diabetes.Front Endocrinol (Lausanne). 2023 Oct 30;14:1236574. doi: 10.3389/fendo.2023.1236574. eCollection 2023. Front Endocrinol (Lausanne). 2023. PMID: 38027145 Free PMC article.
-
Enterovirus VP1 protein and HLA class I hyperexpression in pancreatic islet cells of organ donors with type 1 diabetes.Diabetologia. 2025 Jun;68(6):1197-1210. doi: 10.1007/s00125-025-06384-9. Epub 2025 Mar 17. Diabetologia. 2025. PMID: 40090995 Free PMC article.
-
Enterovirus infection and type 1 diabetes: unraveling the crime scene.Clin Exp Immunol. 2019 Jan;195(1):15-24. doi: 10.1111/cei.13223. Epub 2018 Nov 13. Clin Exp Immunol. 2019. PMID: 30307605 Free PMC article. Review.
-
Potential role of type I interferon in the pathogenic process leading to type 1 diabetes.Curr Opin Endocrinol Diabetes Obes. 2018 Apr;25(2):94-100. doi: 10.1097/MED.0000000000000399. Curr Opin Endocrinol Diabetes Obes. 2018. PMID: 29369915 Free PMC article. Review.
Cited by
-
Persistent coxsackievirus B infection and pathogenesis of type 1 diabetes mellitus.Nat Rev Endocrinol. 2022 Aug;18(8):503-516. doi: 10.1038/s41574-022-00688-1. Epub 2022 Jun 1. Nat Rev Endocrinol. 2022. PMID: 35650334 Free PMC article. Review.
-
The N6-methyladenosine RNA epigenetic modification modulates the amplification of coxsackievirus B1 in human pancreatic beta cells.Front Microbiol. 2024 Dec 18;15:1501061. doi: 10.3389/fmicb.2024.1501061. eCollection 2024. Front Microbiol. 2024. PMID: 39744389 Free PMC article.
-
Fighting Enteroviral Infections to Prevent Type 1 Diabetes.Microorganisms. 2022 Apr 1;10(4):768. doi: 10.3390/microorganisms10040768. Microorganisms. 2022. PMID: 35456818 Free PMC article.
-
Detection of Antiviral Tissue Responses and Increased Cell Stress in the Pancreatic Islets of Newly Diagnosed Type 1 Diabetes Patients: Results From the DiViD Study.Front Endocrinol (Lausanne). 2022 Jul 26;13:881997. doi: 10.3389/fendo.2022.881997. eCollection 2022. Front Endocrinol (Lausanne). 2022. PMID: 35957810 Free PMC article.
-
How benign autoimmunity becomes detrimental in type 1 diabetes.Proc Natl Acad Sci U S A. 2021 Nov 2;118(44):e2116508118. doi: 10.1073/pnas.2116508118. Proc Natl Acad Sci U S A. 2021. PMID: 34697240 Free PMC article. No abstract available.
References
-
- Thomas N. J., Jones S. E., Weedon M. N., Shields B. M., Oram R. A., Hattersley A. T., Frequency and phenotype of type 1 diabetes in the first six decades of life: A cross-sectional, genetically stratified survival analysis from UK Biobank. Lancet Diabetes Endocrinol. 6, 122–129 (2018). - PMC - PubMed
-
- CDC, National Diabetes Statistics Report 2020. Estimates of diabetes and its burden in the United States, 32 (2020).
-
- Todd J. A., Etiology of type 1 diabetes. Immunity 32, 457–467 (2010). - PubMed
Publication types
Grants and funding
LinkOut - more resources
Full Text Sources
Other Literature Sources
Research Materials
