

An Expanded Gene Catalog of Mouse Gut Metagenomes
- PMID: 33627510
- PMCID: PMC8544893
- DOI: 10.1128/mSphere.01119-20
An Expanded Gene Catalog of Mouse Gut Metagenomes
Abstract
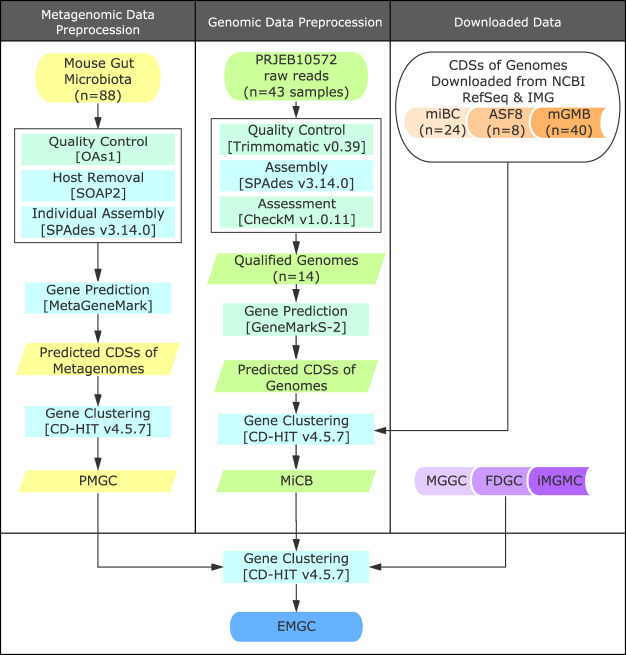
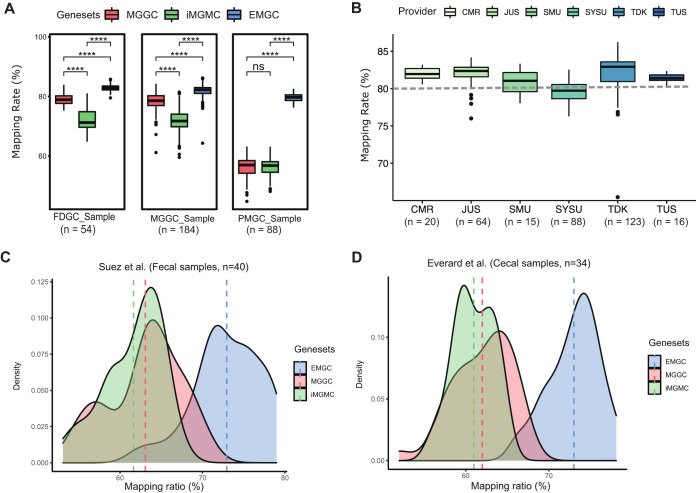
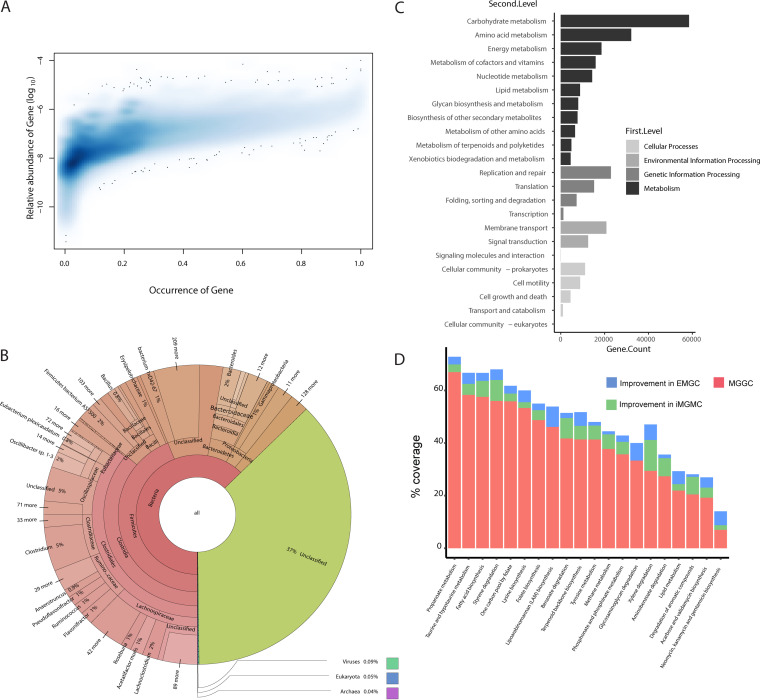
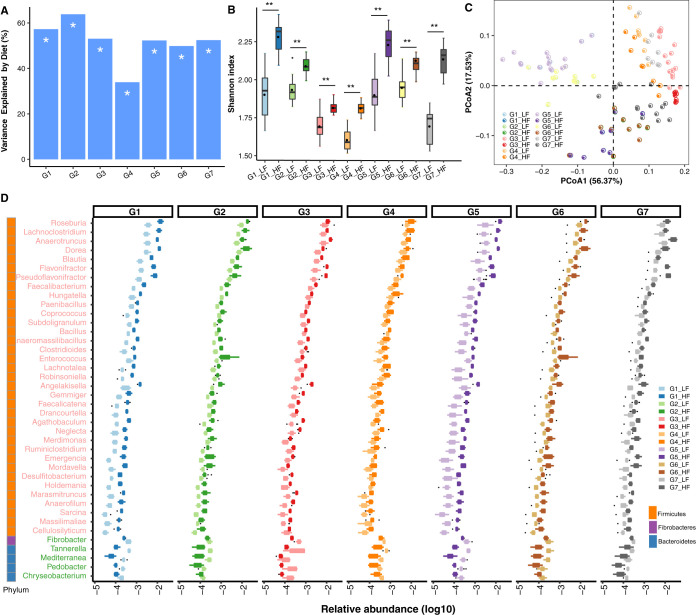
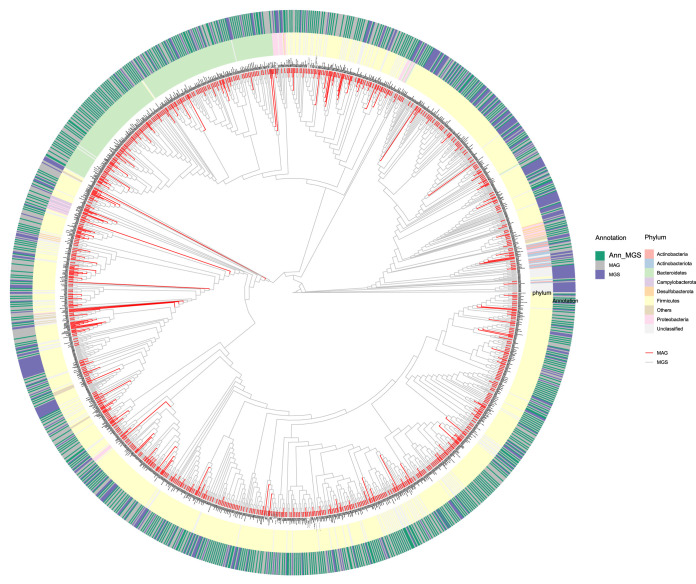
High-quality and comprehensive reference gene catalogs are essential for metagenomic research. The rather low diversity of samples used to construct existing catalogs of the mouse gut metagenome limits the numbers of identified genes in existing catalogs. We therefore established an expanded catalog of genes in the mouse gut metagenome (EMGC) containing >5.8 million genes by integrating 88 newly sequenced samples, 86 mouse gut-related bacterial genomes, and 3 existing gene catalogs. EMGC increases the number of nonredundant genes by more than 1 million genes compared to the so-far most extensive catalog. More than 60% of the genes in EMGC were assigned to Bacteria, with 54.20% being assigned to a phylum and 35.33% to a genus, while 30.39% were annotated at the KEGG orthology level. Nine hundred two metagenomic species (MGS) assigned to 122 taxa are identified based on the EMGC. The EMGC-based analysis of samples from groups of mice originating from different animal providers, housing laboratories, and genetic strains substantiated that diet is a major contributor to differences in composition and functional potential of the gut microbiota irrespective of differences in environment and genetic background. We envisage that EMGC will serve as a valuable reference data set for future metagenomic studies in mice.IMPORTANCE We established an expanded gene catalog of the mouse gut metagenome not only to increase the sample size compared to that in existing catalogs but also to provide a more comprehensive reference data set of the mouse gut microbiome for bioinformatic analysis. The expanded gene catalog comprises more than 5.8 million unique genes, as well as a wide range of taxonomic and functional information. Particularly, the analysis of metagenomic species with the expanded gene catalog reveals a great novelty of mouse gut-inhabiting microbial species. We envisage that the expanded gene catalog of the mouse gut metagenome will serve as a valuable bioinformatic resource for future gut metagenomic studies in mice.
Keywords: diet; gene catalog; metagenomic species; mouse gut metagenome.
Copyright © 2021 Zhu et al.
Figures
Similar articles
-
Human reference gut microbiome catalog including newly assembled genomes from under-represented Asian metagenomes.Genome Med. 2021 Aug 27;13(1):134. doi: 10.1186/s13073-021-00950-7. Genome Med. 2021. PMID: 34446072 Free PMC article.
-
A catalog of the mouse gut metagenome.Nat Biotechnol. 2015 Oct;33(10):1103-8. doi: 10.1038/nbt.3353. Epub 2015 Sep 28. Nat Biotechnol. 2015. PMID: 26414350
-
Expanded catalog of microbial genes and metagenome-assembled genomes from the pig gut microbiome.Nat Commun. 2021 Feb 17;12(1):1106. doi: 10.1038/s41467-021-21295-0. Nat Commun. 2021. PMID: 33597514 Free PMC article.
-
The Landscape of Genetic Content in the Gut and Oral Human Microbiome.Cell Host Microbe. 2019 Aug 14;26(2):283-295.e8. doi: 10.1016/j.chom.2019.07.008. Cell Host Microbe. 2019. PMID: 31415755 Free PMC article. Review.
-
Integrating functional metagenomics to decipher microbiome-immune interactions.Immunol Cell Biol. 2024 Sep;102(8):680-691. doi: 10.1111/imcb.12798. Epub 2024 Jul 2. Immunol Cell Biol. 2024. PMID: 38952337 Review.
Cited by
-
The Role of Nondigestible Oligosaccharides in Alleviating Human Chronic Diseases by Regulating the Gut Microbiota: A Review.Foods. 2024 Jul 8;13(13):2157. doi: 10.3390/foods13132157. Foods. 2024. PMID: 38998662 Free PMC article. Review.
-
The Mouse Gastrointestinal Bacteria Catalogue enables translation between the mouse and human gut microbiotas via functional mapping.Cell Host Microbe. 2022 Jan 12;30(1):124-138.e8. doi: 10.1016/j.chom.2021.12.003. Epub 2021 Dec 30. Cell Host Microbe. 2022. PMID: 34971560 Free PMC article.
-
Recovering High-Quality Host Genomes from Gut Metagenomic Data through Genotype Imputation.Adv Genet (Hoboken). 2022 May 6;3(3):2100065. doi: 10.1002/ggn2.202100065. eCollection 2022 Sep. Adv Genet (Hoboken). 2022. PMID: 36620197 Free PMC article.
-
Novel complete methanogenic pathways in longitudinal genomic study of monogastric age-associated archaea.Anim Microbiome. 2023 Jul 17;5(1):35. doi: 10.1186/s42523-023-00256-6. Anim Microbiome. 2023. PMID: 37461084 Free PMC article.
-
Resources to Facilitate Use of the Altered Schaedler Flora (ASF) Mouse Model to Study Microbiome Function.mSystems. 2022 Oct 26;7(5):e0029322. doi: 10.1128/msystems.00293-22. Epub 2022 Aug 15. mSystems. 2022. PMID: 35968975 Free PMC article.
References
Publication types
MeSH terms
LinkOut - more resources
Full Text Sources
Other Literature Sources
