. 2021 Feb 24;12(1):1270.
doi: 10.1038/s41467-021-21550-4.

Sialic acids in pancreatic cancer cells drive tumour-associated macrophage differentiation via the Siglec receptors Siglec-7 and Siglec-9

Affiliations

Sialic acids in pancreatic cancer cells drive tumour-associated macrophage differentiation via the Siglec receptors Siglec-7 and Siglec-9

Ernesto Rodriguez et al. Nat Commun. .

Abstract

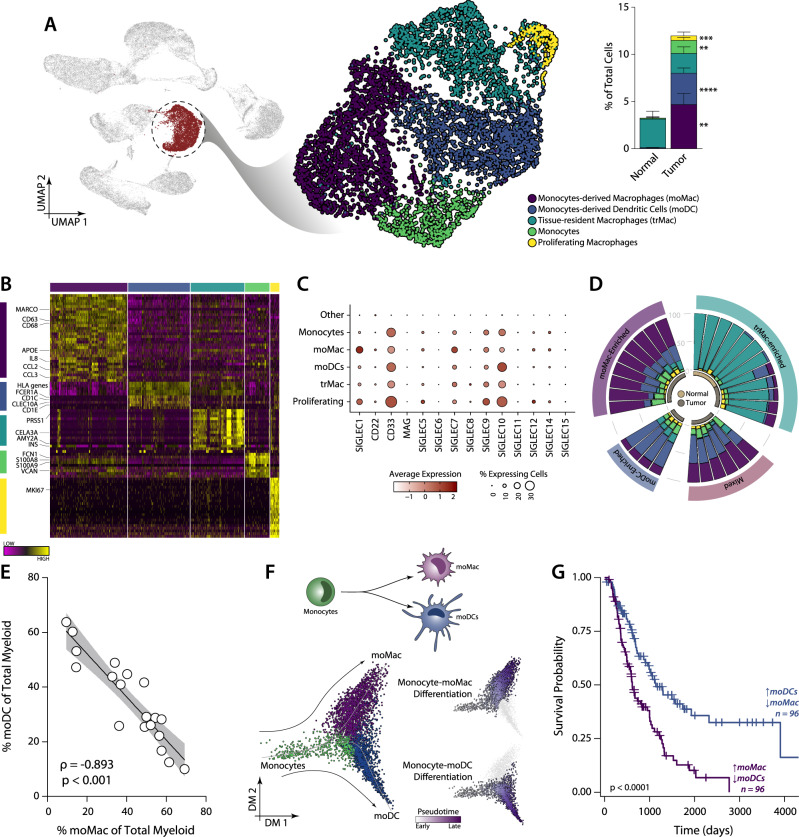
Changes in glycosylation during tumour progression are a key hallmark of cancer. One of the glycan moieties generally overexpressed in cancer are sialic acids, which can induce immunomodulatory properties via binding to Siglec receptors. We here show that Pancreatic Ductal Adenocarcinoma (PDAC) tumour cells present an increased sialylation that can be recognized by Siglec-7 and Siglec-9 on myeloid cells. We identified the expression of the α2,3 sialyltransferases ST3GAL1 and ST3GAL4 as main contributor to the synthesis of ligands for Siglec-7 and Siglec-9 in tumour cells. Analysing the myeloid composition in PDAC, using single cell and bulk transcriptomics data, we identified monocyte-derived macrophages as contributors to the poor clinical outcome. Tumour-derived sialic acids dictate monocyte to macrophage differentiation via signalling through Siglec-7 and Siglec-9. Moreover, triggering of Siglec-9 in macrophages reduce inflammatory programmes, while increasing PD-L1 and IL-10 expression, illustrating that sialic acids modulate different myeloid cells. This work highlights a critical role for sialylated glycans in controlling immune suppression and provides new potential targets for cancer immunotherapy in PDAC.


Conflict of interest statement

The authors declare no competing interests.

Figures

Fig. 1
Fig. 1. Sialylation is increased in pancreatic ductal adenocarcinoma (PDAC).
A Representation of the different pathways that contribute to sialylation of glycans. B Gene set enrichment analysis of the pathways described in (A) in normal and tumour tissue. ΔGSVA score was calculated as the difference between the GSVA score in tumour and in normal tissue. C Immunohistochemistry analysis of the expression of sialylated glycans in normal and tumour tissue, using plant lectins specific for α2,3 (MAL I and MAL II) and α2,6 sialic acid (SNA). Data presented as mean values ± SEM. DE Evaluation of sialic acid expression in PDAC cell lines by (D) ELISA and (E) flow cytometry. ΔD.O. at 450 nm was calculated as the difference of the O.D at 450 nm of the sample and the one of the uncoated control.
Fig. 2
Fig. 2. PDAC cancer cells express ligands for the myeloid receptors Siglec-7 and Siglec-9.
AB Expression of Siglec-7 and Siglec-9 ligands in PDAC cancer cell lines evaluated by flow cytometry (A) and ELISA (B). In ELISA, the positive control for each Siglec-hFc was set as 100%. Representative results of three independent experiments. C, D Characterisation of Siglec ligands by using (C) glycosylation inhibitors and (D) knock down of different a2,3 sialyltransferases. Mean of control siRNA was set as 100%. Statistics: Pairwise comparisons of each condition against the respective control using Two-way ANOVA with Dunnett’s multiple comparisons test (*p ≤ 0.05; **p ≤ 0.01; ***p ≤ 0.001; ****p ≤ 0.0001). E Survival analysis of PDAC patients based on the mean expression of ST3GAL1 and ST3GAL4 using the Log-rank test in the TCGA-PAAD data set. Top and bottom thirds of the mean expression were used to define high and low expression, respectively. F Expression of Siglec receptors in different cell populations present in PDAC tumours in scRNA-Seq from Peng et al. G Immunofluorescent staining of Siglec-7 and Siglec-9 receptors in PDAC. Representative staining of n = 6 PDAC patients.
Fig. 3
Fig. 3. Characterisation of the myeloid cells in PDAC.
A Characterisation and quantification of the myeloid cell population found in the scRNA-Seq analysis of PDAC tumours from Peng et al. Data presented as mean values ± SEM. B Heatmap highlighting the markers characterising each myeloid population. C Expression of Siglec receptors in the different myeloid populations. D Clustering of patients using the presence of myeloid populations distinguishes patient groups. E Correlation between the moDC and moMac as a % of total myeloid cells. Spearman correlation coefficient, p value and 95% confidence interval are depicted in the figure. F Analysis of the differentiation of monocytes towards dendritic cells or macrophages using diffusion map (using the R package destiny) and pseudotime (slingshot). G Survival analysis based on a moMac/moDCs ratio Score in bulk transcriptomic data using the Log-rank test. moMac/moDC ratio Score was defined as the difference between a moMac and a moDCs Score (ScoremoMac − ScoremoDCs). Top and bottom thirds were used to define samples enriched in moMac or moDCs, respectively. Data set shown: E-MTAB-6138.
Fig. 4
Fig. 4. Characterisation of the myeloid cells in PDAC.
A moMac-enriched patients contain a higher content of cancer cells in scRNA-seq data from Peng et al. Patients numbers: trMac-enriched (n = 5), moDCs-enriched (n = 4), mixed (n = 6), moMac-enriched (n = 9). Data presented as mean values ± SEM. Statistics: Kruskal-Wallis test with Dunn’s multiple comparisons test. B Proposed model for tumour cell-mediated monocyte to macrophage differentiation in PDAC. C NicheNet algorithm predicts M-CSF (CSF1) as tumour-derived factor that influences moMac differentiation. D Co-culture of PDAC cell lines with monocytes induces their differentiation to macrophages. E Quantification of CD163 positive cells after co-culture indicated in (D). Data presented as mean values ± SEM. F Analysis of monocyte differentiation using diffusion maps (using the R package destiny). Three-dimensional graph showing the inferred differentiation pathways and the expression of CD163. G Differentiation of monocytes to CD163+ macrophages in co-cultures of monocytes and cancer cell lines in a transwell model and in the presence of a blocking antibody to CSF1R. Data presented as mean values ± SEM. Statistics: Friedman test (*p < 0.05).
Fig. 5
Fig. 5. Sialic acids contribute to the differentiation of tumour moMac by interacting with Siglec-7 and Siglec-9 in monocytes.
A Presence of Siglec ligands in the supernatants of cell lines analysed by ELISA. B Histogram of Siglec-7 and Siglec-9 expression in circulating monocytes as analysed by flow cytometry, non-stained cells in grey and blood-derived monocytes from healthy donors in black line. C Analysis of CD163+ MR+ CD45+ CD14+ cells after the co-culture of tumour cell lines with monocytes in the presence of Siglec-7 and Siglec-9 blocking antibodies. Data presented as mean values ± SEM. Statistics: Friedman test (**p ≤ 0.01). D Representation of the role of CMAS in cellular sialylation. E Flow cytometric analysis of α2,3 linked sialic acids using MAAII lectin staining in the BxPC3 CMAS knockout and mock cells. F Expression of CD206 and CD163 in CD45+ CD14+ cells after co-culture of monocytes with mock and CMAS KO cell lines. Relative expression was calculated with respect to the mock cell lines (set as 1). Data presented as mean values ± SEM. Statistics: Two-tailed Wilcoxon test (*p < 0.05). G) IL-10 production after co-culture was analysed by ELISA. Data presented as mean values ± SEM. Statistics: Two-tailed Wilcoxon test (*p < 0.05).
Fig. 6
Fig. 6. Dendrimers carrying a2,3 sialylated structures are able to modulate monocytes and macrophages.
A Monocytes were stimulated with a2,3 sialic acid dendrimers for four days in the presence or absence of M-CSF. B Expression of CD163, CD206 and PD-L1 in CD14+ cells after stimulation. Relative expression was calculated with respect to unstimulated monocytes. Data presented as mean values ± SEM. C Presence of IL-10 and IL-6 in supernatants was evaluated by ELISA. Data presented as mean values ± SEM. D Binding of Siglec-7 and Siglec-9 to sialic acid dendrimers. Data presented as mean values ± SEM. E Phospho-Immunoreceptor array of monocytes stimulated with α2,3 sialic acid and control dendrimers. F Expression of Siglec receptors in different monocyte-derived macrophages was evaluated by flow cytometry. G M-CSF monocyte-derived macrophages were stimulated with α2,3 sialic acid dendrimers in the presence or absence of LPS. H, I Expression of co-stimulatory markers (H) and cytokine production (I) after stimulation. In (H), relative expression was calculated with respect to unstimulated macrophages. Statistics: Pairwise comparisons of each condition against the respective control using Two-way ANOVA with Dunnett’s multiple comparisons test (*p ≤ 0.05; **p ≤ 0.01). J Scheme summarising the results of this paper. ① Circulating monocytes that infiltrate the tumour can interact with tumour-derived sialylated structures via the receptors Siglec-7 and Siglec-9. ② Triggering of Siglec receptors synergises with M-CSF to induce the differentiation of moMac and concomitant expression of IL-6 and IL-10. ③ Sialic acid triggering of Siglec-9 in moMac affects their expression of co-stimulatory molecules and cytokine production.

References

    1. Siegel RL, Miller KD, Jemal A. Cancer statistics, 2020. CA Cancer J. Clin. 2020;70:7–30. doi: 10.3322/caac.21590. - DOI - PubMed
    1. Rahib L, et al. Projecting cancer incidence and deaths to 2030: the unexpected burden of thyroid, liver, and pancreas cancers in the United States. Cancer Res. 2014;74:2913–2921. doi: 10.1158/0008-5472.CAN-14-0155. - DOI - PubMed
    1. Dougan SK. The pancreatic cancer microenvironment. Cancer J. 2017;23:321–325. doi: 10.1097/PPO.0000000000000288. - DOI - PubMed
    1. Gajewski TF, Schreiber H, Fu YX. Innate and adaptive immune cells in the tumor microenvironment. Nat. Immunol. 2013;14:1014–1022. doi: 10.1038/ni.2703. - DOI - PMC - PubMed
    1. Kiss M, Van Gassen S, Movahedi K, Saeys Y, Laoui D. Myeloid cell heterogeneity in cancer: not a single cell alike. Cell Immunol. 2018;330:188–201. doi: 10.1016/j.cellimm.2018.02.008. - DOI - PubMed

Publication types

MeSH terms