. 2021 Feb 24;12(1):1279.
doi: 10.1038/s41467-021-21542-4.

Revealing the role of the human blood plasma proteome in obesity using genetic drivers

Affiliations

Revealing the role of the human blood plasma proteome in obesity using genetic drivers

Shaza B Zaghlool et al. Nat Commun. .

Abstract

Blood circulating proteins are confounded readouts of the biological processes that occur in different tissues and organs. Many proteins have been linked to complex disorders and are also under substantial genetic control. Here, we investigate the associations between over 1000 blood circulating proteins and body mass index (BMI) in three studies including over 4600 participants. We show that BMI is associated with widespread changes in the plasma proteome. We observe 152 replicated protein associations with BMI. 24 proteins also associate with a genome-wide polygenic score (GPS) for BMI. These proteins are involved in lipid metabolism and inflammatory pathways impacting clinically relevant pathways of adiposity. Mendelian randomization suggests a bi-directional causal relationship of BMI with LEPR/LEP, IGFBP1, and WFIKKN2, a protein-to-BMI relationship for AGER, DPT, and CTSA, and a BMI-to-protein relationship for another 21 proteins. Combined with animal model and tissue-specific gene expression data, our findings suggest potential therapeutic targets further elucidating the role of these proteins in obesity associated pathologies.


Conflict of interest statement

The authors declare no competing interests.

Figures

Fig. 1
Fig. 1. Study overview.
A Protein-wide association study with BMI conducted in KORA with confirmation/replication in INTERVAL and QMDiab. B Protein-wide association study with BMI polygenic scores (in KORA and QMDiab) C Bidirectional causality analysis to determine if BMI has a potentially causal effect on protein levels and/or if proteins are potentially causal in the development of obesity. D Studying tissue-specific gene expression in humans/mice, identification of genes encoding proteins related to obesity traits, searching for existing animal models, and identification of potentially targetable proteins through drug database searches.
Fig. 2
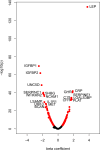
Fig. 2. Protein-wide association study with body mass index.
Volcano plot showing the association of BMI with plasma protein levels in KORA using a linear regression model, including age and sex as covariates. Leptin is the strongest protein associated with BMI (p = 3.34 × 10−136) in addition to 151 significantly associated proteins (red).
Fig. 3
Fig. 3. Stratification of the KORA samples according to GPSBMI deciles (n = 996 biologically independent samples).
There is a steep slope with respect to both BMI (A) and various protein measures (BD) at the upper and lower deciles. LEP, like BMI, has an increasing trend, while IGFBP1 and WFIKKN2 has a decreasing trend. The centers are the mean protein values and the error bars are the 95% confidence intervals.
Fig. 4
Fig. 4. Extreme GPSBMI is a strong risk factor for increased protein levels and increased BMI (n = 996 biologically independent samples).
The effects from the linear regression model of GPSBMI on A WFIKKN2, B IGFBP1, and C LEP are almost quadrupled in the extreme 5% of the sample compared to the full data (n = 996). The centers are the regression coefficients (betas) and the error bars are the 95% confidence intervals.
Fig. 5
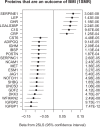
Fig. 5. Forest plot of the causal estimate of BMI on various proteins in the one-sample MR analysis (KORA).
BMI is suggested to have a causal effect on 24 out of 152 replicated proteins, using the 2SLS method. The BMI polygenic score (GPSBMI) was used as an instrument for BMI in this analysis.
Fig. 6
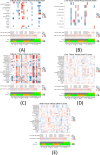
Fig. 6. Adipose, liver, and brain tissue gene expression associations with obesity traits in mouse panels.
The bi-weight mid-correlation coefficients (median-based measures of similarity) and p values are shown for obesity-related traits with adipose/liver tissue gene expression levels using a threshold of p < 0.05 and absolute correlation coefficient >0.1 in two datasets: (A/B) the HMDP dataset consisting of 706 mice fed a standard chow diet and (C/D/E) the F2 dataset which is a cross of the inbred ApoE−/− C57BL/6J and C3H/HeJ strains fed a high fat + cholesterol diet. The significance of the correlations is as indicated (*** for p < 0.001, ** for p < 0.01, and * for p < 0.05). The bottom part of each plot includes the bi-directional MR results (direction and significance), whether there are existing drugs that target the tested proteins, and the animal knockout model information. Gray boxes indicate missing data.

References

    1. Barsh GS, Farooqi IS, O’Rahilly S. Genetics of body-weight regulation. Nature. 2000;404:644–651. doi: 10.1038/35007519. - DOI - PubMed
    1. Locke AE, et al. Genetic studies of body mass index yield new insights for obesity biology. Nature. 2015;518:197–U401. doi: 10.1038/nature14177. - DOI - PMC - PubMed
    1. Yengo L, et al. Meta-analysis of genome-wide association studies for height and body mass index in approximately 700000 individuals of European ancestry. Hum. Mol. Genet. 2018;27:3641–3649. doi: 10.1093/hmg/ddy271. - DOI - PMC - PubMed
    1. Hruby A, Hu FB. The epidemiology of obesity: a big picture. Pharmacoeconomics. 2015;33:673–689. doi: 10.1007/s40273-014-0243-x. - DOI - PMC - PubMed
    1. Symonds ME, Budge H, Frazier-Wood AC. Epigenetics and obesity: a relationship waiting to be explained. Hum. Hered. 2013;75:90–97. doi: 10.1159/000352009. - DOI - PubMed

Publication types