. 2021 Feb 24;12(1):1260.
doi: 10.1038/s41467-021-21389-9.

Comparison of rhesus and cynomolgus macaques as an infection model for COVID-19

Affiliations

Comparison of rhesus and cynomolgus macaques as an infection model for COVID-19

Francisco J Salguero et al. Nat Commun. .

Abstract

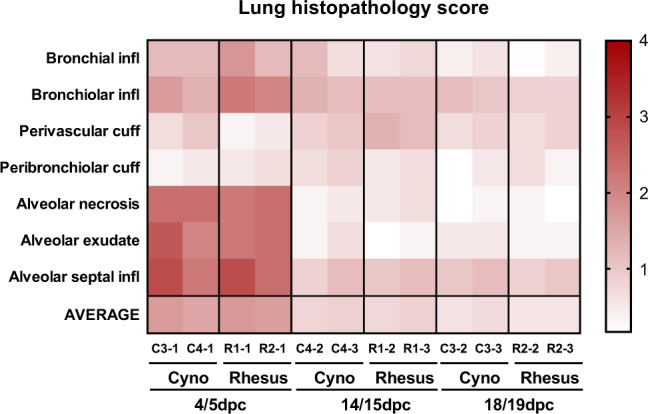
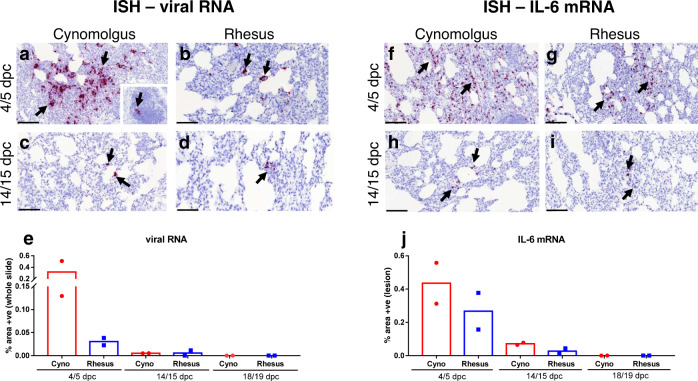
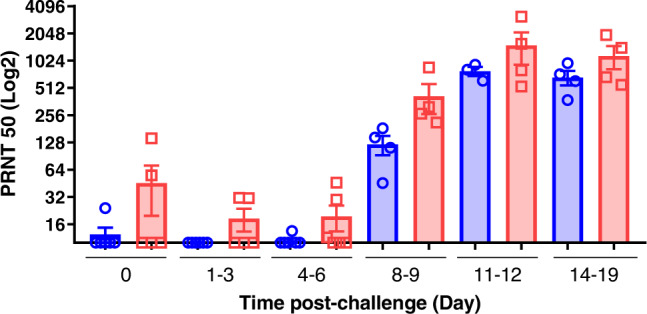
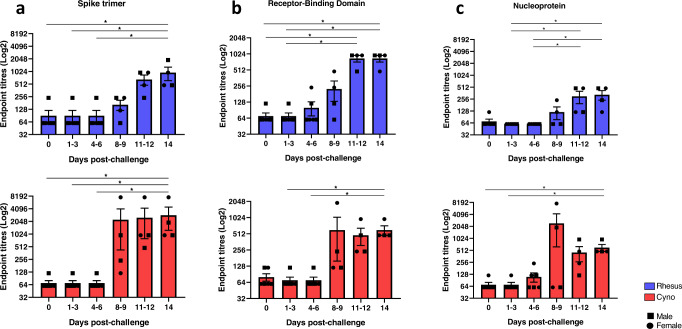
A novel coronavirus, SARS-CoV-2, has been identified as the causative agent of the current COVID-19 pandemic. Animal models, and in particular non-human primates, are essential to understand the pathogenesis of emerging diseases and to assess the safety and efficacy of novel vaccines and therapeutics. Here, we show that SARS-CoV-2 replicates in the upper and lower respiratory tract and causes pulmonary lesions in both rhesus and cynomolgus macaques. Immune responses against SARS-CoV-2 are also similar in both species and equivalent to those reported in milder infections and convalescent human patients. This finding is reiterated by our transcriptional analysis of respiratory samples revealing the global response to infection. We describe a new method for lung histopathology scoring that will provide a metric to enable clearer decision making for this key endpoint. In contrast to prior publications, in which rhesus are accepted to be the preferred study species, we provide convincing evidence that both macaque species authentically represent mild to moderate forms of COVID-19 observed in the majority of the human population and both species should be used to evaluate the safety and efficacy of interventions against SARS-CoV-2. Importantly, accessing cynomolgus macaques will greatly alleviate the pressures on current rhesus stocks.


Conflict of interest statement

The authors declare no competing interests.

Figures

Fig. 1
Fig. 1. Experimental study design.
Rhesus and cynomolgus macaques were inoculated with severe acute respiratory syndrome coronavirus 2 (SARS-CoV-2) and culled in groups at three time points (4/5; 14/15 and 18/19 dpc). Animals were monitored for clinical signs and blood/swab/tissue samples were taken for virology, immunology and pathology. CT scan imaging was carried out at 18 dpc.
Fig. 2
Fig. 2. CTscan images from cynomolgus and rhesus macaques infected with SARS-CoV-2 and culled at 18 days post challenge.
Images constructed from CT scans collected 18 days after challenge with SARS-CoV-2 showing pulmonary abnormalities in two cynomolgus (a, b) and one rhesus macaque (c). Arrows in images (a1), (b1) and (c1) indicate areas of peripheral ground glass opacification. Arrows in images (a2) and (c2) indicate areas of ground glass opacification and arrow in image (b2) indicates an area of consolidation. Images from a second rhesus macaque did not have abnormal features.
Fig. 3
Fig. 3. Viral RNA detected by RT-qPCR.
Viral load presented as the geometric mean of RNA copies/mL or individual values, with individual data points overlaid in rhesus macaques (blue) and cynomolgus macaques (red) in (a) nasal wash total RNA, (b) nasal wash Sg RNA, (c) throat swab total RNA, (d) throat swab Sg RNA (e) bronchoalveolar lavage (BAL) total RNA, (f) bronchoalveolar lavage (BAL) Sg RNA (numbers indicate days post-challenge the NHP was euthanised), (g) rectal swab total RNA, (h) whole blood total RNA. n = 2 macaques per group/species at 1, 2, 3, 6, 8, 9, 11, 12, 14, 15, 18 and 19 dpc; n = 1 at 4 dpc; n = 3 at 5 dpc (for BAL; n = 1 at 4 and 5 dpc and n = 2 at 14,15, 18 and 19 dpc). Bars show median values. Dashed lines highlight the LLOQ (lower limit of quantification, 8.57 × 10³ copies/mL for total RNA and 1.29 × 10⁴ copies/mL subgenomic RNA) and LLOD (lower limit of detection, 2.66 × 10³ copies/mL for total RNA, 1.16 × 10³ copies/mL for subgenomic RNA). Positive samples detected below the LLOQ were assigned the value of 5.57 × 10³ copies/mL for total RNA and 12.86 × 10⁴ copies/mL subgenomic RNA. Viral RNA was not detected in naïve animals. Samples for RT-qPCR and sgPCR were assayed in duplicate against a standard curve in triplicate.
Fig. 4
Fig. 4. Histopathological changes in cynomolgus and rhesus macaques during SARS-CoV-2 infection.
Areas of alveolar necrosis observed in cynomolgus macaques at 4/5 dpc with shrunken, eosinophilic cells within the alveolar walls (a, b), together with alveolar oedema (a, arrows; bar = 100 µm), type II pneumocyte hyperplasia and expanded alveolar spaces with inflammatory cell infiltration (b, arrows; bar = 100 µm). Occasional multinucleated cells are observed (b, insert; bar = 20 µm). Similar histopathological changes observed in rhesus macaques, including alveolar necrosis and areas with patchy alveolar oedema (c, arrow; bar = 100 µm), and accumulatios of alveolar macrophages (d, arrow; bar = 100 µm) and bronchial exudates (d, insert; bar = 50 µm). Histopathological changes with less severity observed at 14/15 dpc in cynomolgus macaques, with infiltration of mononuclear cells within alveolar spaces and bronchiolar lumen (e, arrows; bar = 100 µm) and perivascular cuffing (f, arrow; bar = 100 µm). Bronchiole regeneration (g, arrow; bar = 100 µm) and perivascular/peribronchiolar cuffing observed in rhesus macaques at 14/15 dpc (h, arrows; bar = 100 µm), together with BALT proliferation (h, *; bar = 100 µm). Representative images from 6 slides per animal at each time point.
Fig. 5
Fig. 5. Lung histopathology scores.
Heatmap showing the scores for each lung pathology parameter and the average score for each animal culled at 4/5, 14/15 and 18/19 dpc. Severity ranges from 0 to 4: 0 = none; 1 = minimal; 2 = mild; 3 = moderate and 4 = marked/severe.
Fig. 6
Fig. 6. Presence of viral RNA and IL-6 by ISH in cynomolgus and rhesus macaques during SARS-CoV-2 infection.
ISH detection of abundant viral RNA (RNAScope, red chromogen) within the areas of pneumonia (a, arrows) and occasionally in the BALT (a, insert, arrow) in cynomolgus (a, b) and rhesus macaques (b, arrows) at 4/5 dpc. Small amount of viral RNA in the interalveolar septa from cynomolgus (c, arrows) and rhesus macaques (d, arrows) at 14/15 dpc. Image analysis of positively stained area in RNASCope labelled sections for viral RNA (e, whole slide); n = 2 macaques per species and time point; bars represent median values. Abundant presence of IL-6 mRNA in the areas of pneumonia from cynomolgus (f, arrows) and rhesus macaques (g, arrows) at 4/5 dpc. Small amount of IL-6 mRNA positive cells within the interalveolar septa from cynomolgus (h, arrows) and rhesus macaques (i, arrows) at 14/15 dpc. Image analysis of positively stained area in RNASCope labelled sections for IL-6 mRNA (j, areas of lesion); n = 2 macaques per species and time point; bars represent median values. Bars in micrographs=200 µm.
Fig. 7
Fig. 7. Neutralising antibodies in serum measured by Plaque reduction neutralisation test (PRNT50).
Serum neutralisation titres as reciprocal highest dilution resulting in an infection reduction of >50% in samples (PRNT50) pre-challenge and at 1–3, 4–6, 8–9, 11–12 and 14–19 days post-challenge in rhesus macaques (blue) and cynomolgus macaques (red). For rhesus macaques: n = 6 at 0, 1-3 and 4–6 dpc; n = 4 at 8-9 and 14-19 dpc; n = 3 at 11–12 dpc. For cynomolgus macaques: n = 6 at 4–6 dpc; n = 5 at 0 and 1–3 dpc; n = 4 at 8–9; 11–12 and 14–19 dpc. Bars indicating group mean±standard error with PRNT50 determined for individual animals shown as circles and squares respectively. Neutralising antibodies were observed at 8–9 dpc at low levels, increasing from 11 dpc onwards, with higher values in cynomolgus macaques compared to rhesus.
Fig. 8
Fig. 8. SARS-CoV-2-specific IgG antibodies measured by ELISA in naïve and SARS-CoV-2 infected macaques.
Spike- (a), Receptor-Binding Domain- (b) and Nucleoprotein- (c) specific IgG antibodies measured in sera of rhesus and cynomolgus macaques. Sera were collected from uninfected animals (day 0) or 1–3, 4–6, 8–9, 11–12 and 14–19 days following SARS-CoV-2 infection. n = 6 at 0, 1–3 and 4–6 dpc; n = 4 at 8–9, 11–12 and 14 dpc. Bars show the group mean±SEM with an endpoint titre determined for each individual animal shown as squares for males and dots for females. *p ≤ 0.05 (Kruskal–Wallis one-way ANOVA, two-sided). Experiment performed in duplicates.
Fig. 9
Fig. 9. Cellular immune responses to SARS-CoV-2.
a, b IFNγ SFU measured in PBMCs and stimulated with spike protein peptide pools (PP) peptide in (a) rhesus and (b) cynomolgus macaques. PBMC samples were isolated from uninfected animals (naïve) or at early (days 4 and 5) and late (days 14-19) time-points following SARS-CoV-2 infection. Box plots show the group median + /− inter-quartile range, with minimum and maximum values connected by whiskers. Two-tailed Mann–Whitney U-test carried out to compare pre and post-SARS-Cov2 infection where *p ≤ 0.05, **p ≤ 0.01. c, d IFNγ SFU measured in PBMC in response to spike protein megapools (MP) in (c) rhesus and (d) cynomolgus macaques or, (e) in mononuclear cells isolated from lung and spleen. Bars show the group median with SFU measured in individual animals shown as dots. Rhesus macaques summed MP naïve vs late time point p = 0.01. Cynomolgus macaques naïve vs PP9 p = 0.03, naïve vs MP2 p = 0.03, naïve vs MP3 p = 0.01, naïve vs summed p = 0.01. Biologically independent animal samples for (ad); PBMCs: naïve n = 6, early n = 2, late n = 4 Biologically independent animal samples for (e); lung and spleen: early n = 2, late n = 4, (fj) Frequency of major lymphocyte and monocyte cell populations quantified by immunophenotyping assay (fh) CD4+, CD8+ and γδ T-cell frequencies in PBMCs and lung cells, (i) Monocyte subtype frequency in PBMCs and lung MNCs, (j) Natural killer (NK) cell subset frequency in PBMCs and lung MNCs. Stacked bars show the group median with 95% confidence intervals. Biologically independent animal samples for (fj); PBMC: Naïve rhesus n = 8, early rhesus n = 1, late rhesus n = 2, naïve cyno = 7, early cyno n = 2, late cyno n = 2. Lung: early rhesus n = 2, late rhesus n = 3, early cyno n = 2, late cyno n = 2. kn Intracellular cytokine staining data. kl Cytokine and activation marker detection in CD4+, CD8+and γδ T-cells in PBMCs stimulated with M, N and S peptide pools. mn CD107a expression in CD8+ and γδ T-cells in PBMCs. Bars show the group median with cell frequencies measured in individual animals shown as dots.

References

    1. Falsey AR, Walsh EE. Novel coronavirus and severe acute respiratory syndrome. Lancet. 2003;361:1312–1313. doi: 10.1016/S0140-6736(03)13084-X. - DOI - PMC - PubMed
    1. de Groot RJ, et al. Middle East respiratory syndrome coronavirus (MERS-CoV): announcement of the Coronavirus Study Group. J. Virol. 2013;87:7790–7792. doi: 10.1128/JVI.01244-13. - DOI - PMC - PubMed
    1. Callaway E, Cyranoski D, Mallapaty S, Stoye E, Tollefson J. The coronavirus pandemic in five powerful charts. Nature. 2020;579:482–483. doi: 10.1038/d41586-020-00758-2. - DOI - PubMed
    1. WHO. Coronavirus disease (COVID-19) Weekly Epidemiological Update and Weekly Operational Update. 24 November 2020. https://www.who.int/publications/m/item/weekly-epidemiological-update---....
    1. Chen N, et al. Epidemiological and clinical characteristics of 99 cases of 2019 novel coronavirus pneumonia in Wuhan, China: a descriptive study. Lancet. 2020;395:507–513. doi: 10.1016/S0140-6736(20)30211-7. - DOI - PMC - PubMed

Publication types

Substances